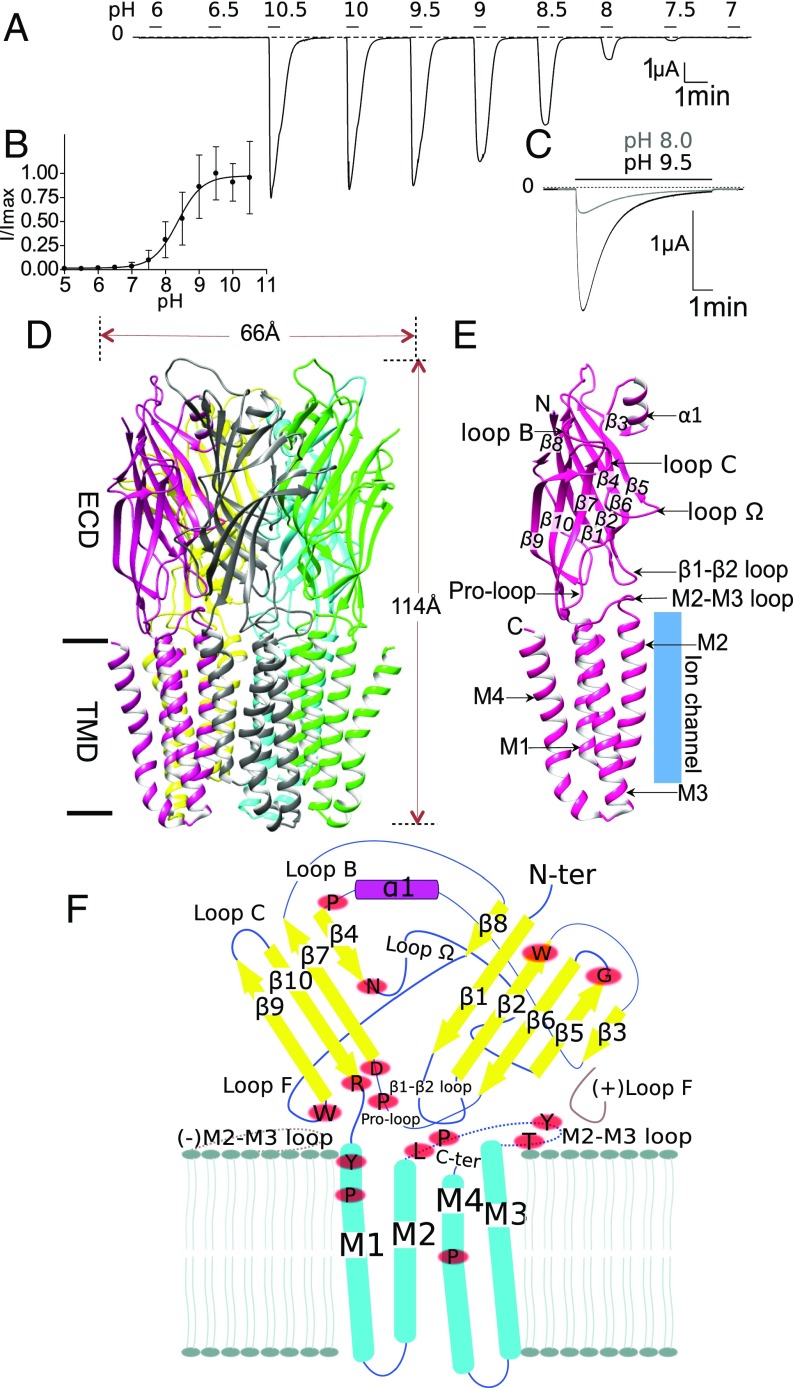
Fig. 1.
Overall characterization of sTeLIC, a bacterial ion channel of the pLGIC family, structure, and activation at alkaline pH. (A) Activation at high pH. Voltage-clamp current trace obtained from an oocyte expressing sTeLIC, showing the effect of successive 30-s-long applications of an extracellular solution at various pH values. (B) pH dose–response curve. Graph of the average ± SD of normalized peak current values with a nonlinear regression fit. The pH50 of 8.6 ± 0.4 with a Hill-slope of 2 ± 1 was found by fitting individual dose–response curves from 13 oocytes. Values are reported as mean ± SD. (C) Superimposed current traces obtained from an oocyte at 19-min interval, showing the effect of 7-min applications of solution at pH 9.5 and then pH 8 (lower and upper traces, respectively) from pH 5. The strong high-pH–induced current decay observed is reversed at pH 5. (D) Side-view cartoon representation of sTeLIC X-ray crystal structure solved at pH 8.0, with subunits individually colored for clarity. (E) Schematic representation of an individual subunit, highlighting the secondary structure elements with labels. This includes the β-strands: β1–β10; α-helices: α1 in the ECD and M1–M4 in the TMD; as well as functionally important loops: loop Ω, loop B, loop C, Pro-loop, the M2–M3 loop, and the β1–β2 loop. (F) Schematic representation of the topology and secondary structure elements of sTeLIC, with neighboring complementary (−) and principal (+) subunit interactions showing the structural context of functionally important loops (in brown), and the strictly conserved residues (red ovals) among bacterial receptors (whose multialignment is shown in SI Appendix, Fig. S13).

