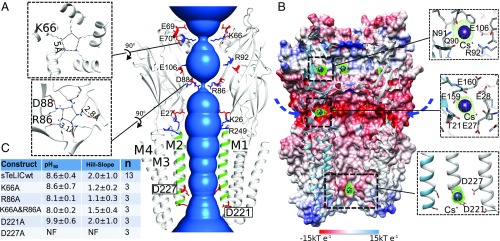
Fig. 3.
Monovalent ion binding sites and permeation pathway in sTeLIC. (A) The solvent-accessible region from the vestibule of the ECD to the pore of the TMD is shown in blue. Two of the front subunits are removed for clarity. M2 α-helices are colored in green. Charged amino acids along the putative ion permeation pathway are represented in sticks, with side chains of negatively charged amino acids colored in red and positively charged amino acids colored in blue. The two pore residues D221 and D227 are boxed for emphasis. The top-down view showing the two constriction rings for K66 and R86 are shown as Insets (Left). (B) Cutaway view of receptor inner surface colored by electrostatic potential from red (−15 kT e−1) to blue (15 kT e−1). The putative lateral ion permeation pathways are indicated with arrows. An anomalous Fourier difference electron-density map (contoured at 4.5 σ), with diffraction data collected at the peak of the anomalous signal of Cs+ (PDB ID 6FVR), is shown in a green mesh, with the Cs+ ions shown in purple spheres. (C) Summary of the electrophysiological data of five mutated constructs of sTeLIC: D221A, D227A, K66A, R86A, and the double-mutant K66A-R86A. The mean ± SD value of pH50 and Hill-slope are presented. The mutant-construct D227A was nonfunctional (NF) (see also SI Appendix, Fig. S5).

