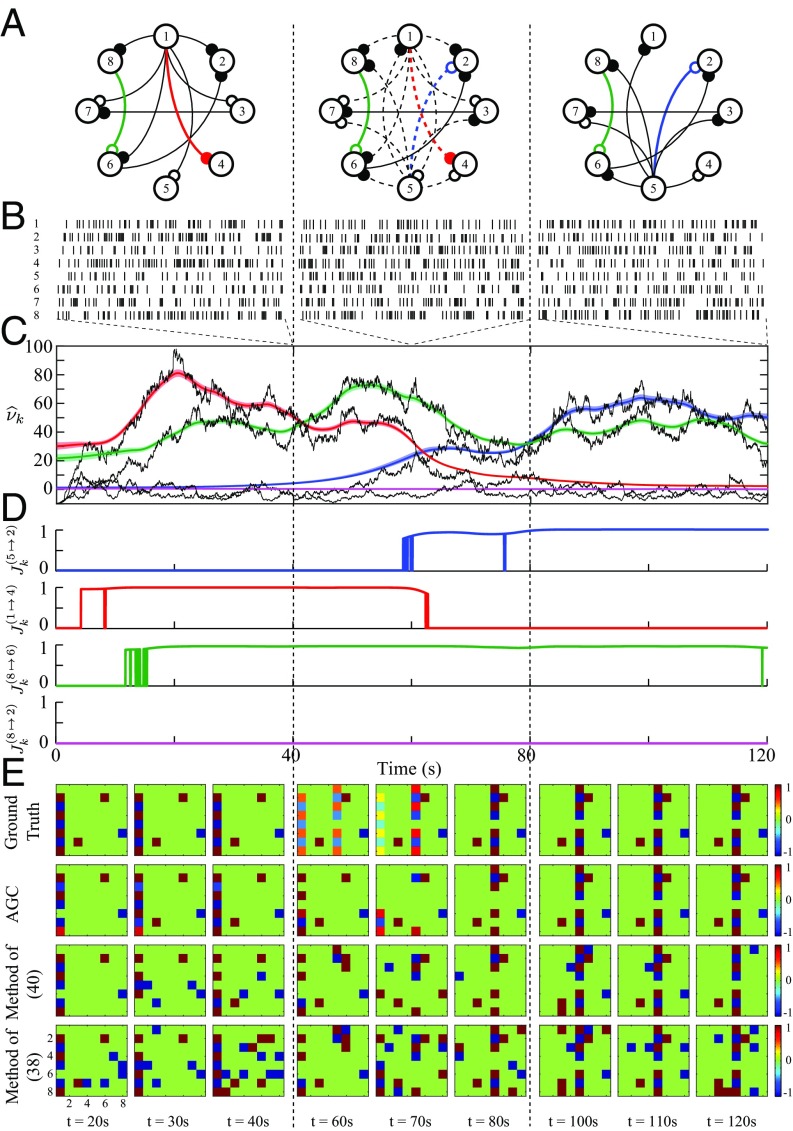
Fig. 3.
Functional network dynamics inference from simulated spikes. (A) Three states of the functional network evolution, where neurons (vertices) are interacting through static (solid edges) or dynamic (dashed edges) causal links of inhibitory (open circles) or excitatory (filled circles) nature. (B) One realization of simulated spikes within windows of s selected at s. (C) Estimated noncentrality across time corresponding to four selected GC links (color-coded in network map), along with the shifted deviance differences (black traces) and the confidence regions for each estimated trace (colored traces). (D) Four panels of estimated -statistics corresponding to the selected GC links. (E) Performance comparison of the causal inference methods: (i) the proposed AGC method (second row), (ii) the static GC method in ref. 40 (third row), and (iii) the functional connectivity method in ref. 38 (last row), along with the true causality maps (first row). Each panel represents the estimated causality map at a specific time.

