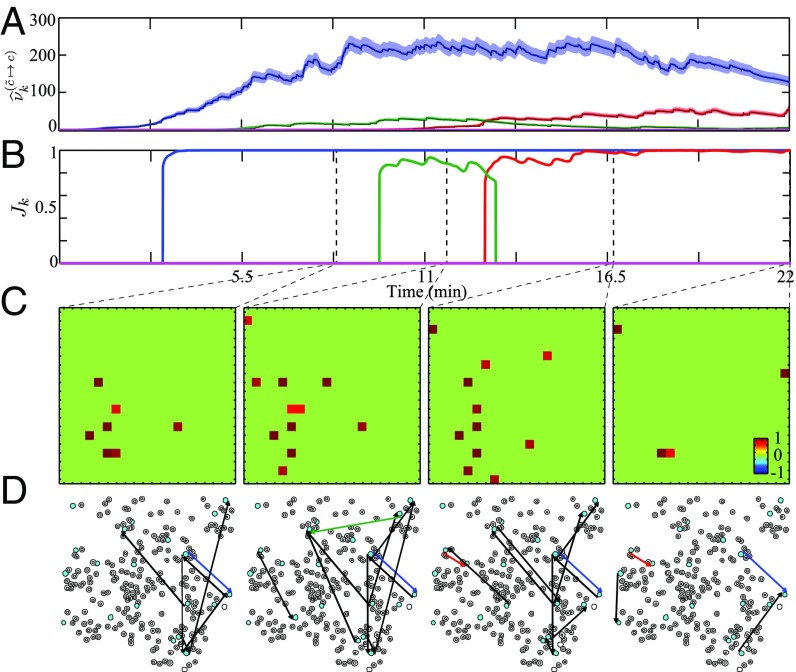
Fig. 5.
Adaptive G-causal interactions among ensemble of neurons in mouse auditory cortex under spontaneous activity. The time course of estimated GC changes for four selected GC links obtained through (A) noncentrality parameter and (B) J-statistics . (C) AGC map estimates at four selected points in time, marked by the dashed vertical lines in the top panel. (D) network maps overlaid on the slice, showing cells with black circles and the selected cells highlighted in cyan. The detected GC links are depicted in black directed arrows and colored for the selected links.

