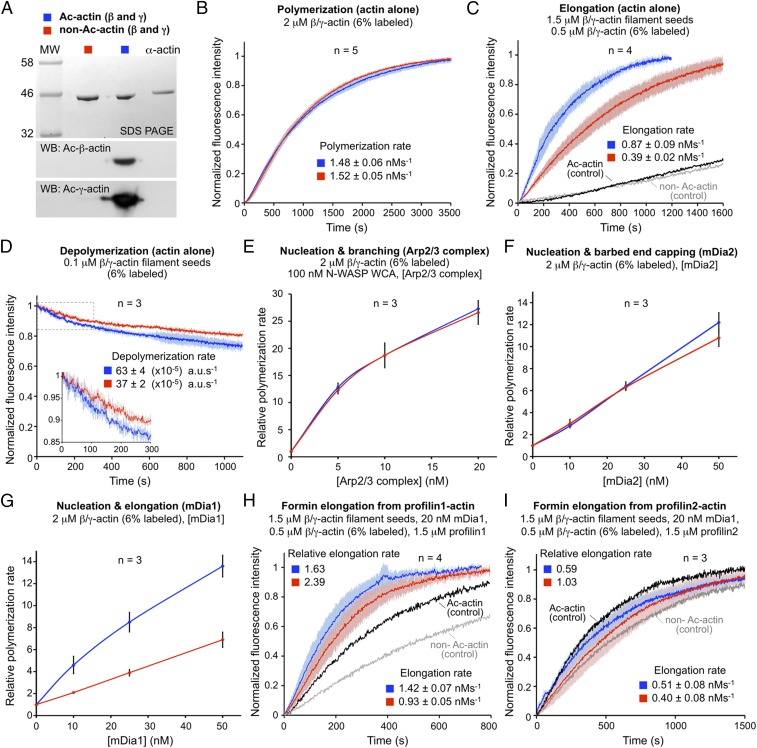
Fig. 4.
Actin Nt-acetylation affects filament elongation and depolymerization. (A) Cytoplasmic actin (a mixture of β and γ isoforms) purified from wild-type and NAA80-KO cells was analyzed by SDS/PAGE and Western blotting using isoform- and Nt-acetylation–specific Ac-β-actin and Ac-γ-actin antibodies. Nt-acetylated α-skeletal actin (15) is shown as reference. (B) The polymerization rate of β/γ-actin alone is unchanged with or without Nt-acetylation. Data are shown as the average curve from five independent experiments (as indicated), with SD error bars in lighter color (Ac-actin, blue; non–Ac-actin, red). (C) The barbed-end elongation rate of β/γ-actin filament seeds is ∼2.2-fold faster for Ac-actin (blue) than for non–Ac-actin (red). The polymerization of Ac-actin (black) and non–Ac-actin (gray) in the absence of seeds is shown as control. (D) The depolymerization rate of β/γ-actin filament seeds is ∼1.7-fold faster for Ac-actin (blue) than for non–Ac-actin (red). (E) The concentration dependence of polymerization rates of actin assembly by Arp2/3 complex (nucleation and branching) shows no difference for Ac-actin (blue) vs. non–Ac-actin (red) (see also Fig. S7B). (F) The concentration dependence of polymerization rates of actin assembly induced by mDia2 (nucleation and barbed-end capping) is unchanged with or without Nt-acetylation (see also Fig. S7C). (G) The concentration dependence of polymerization rates of actin assembly induced by mDia1 (nucleation and barbed-end elongation) is >twofold faster for Ac-actin (blue) than for non–Ac-actin (red) (see also Fig. S7D). (H) The elongation rate of filament seeds by mDia1 from profilin1-actin is ∼35% faster for Ac-actin (blue) than for non–Ac-actin (red). For both actins, the elongation rate of mDia1 from profilin1-actin is faster than the elongation rate of β/γ-actin seeds alone (shown as controls). (I) In contrast, barbed-end elongation by mDia1 from profilin2-actin is unchanged for non–Ac-actin (red) and is reduced ∼40% for Ac-actin (blue) relative to the elongation rate of β/γ-actin seeds. Rates are reported as the mean ± SEM of the number of independent experiments indicated in each panel.

