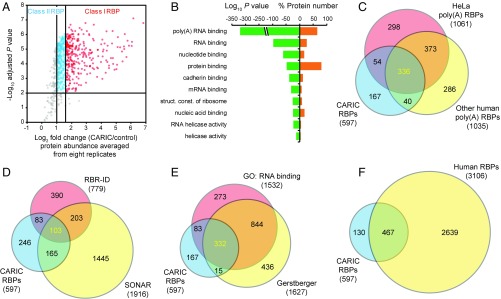
Fig. 3.
Proteomic analysis of CARIC RBPs. (A) Volcano plot displaying the averaged log2 enrichment ratios from eight replicates (x axis) and their adjusted P values (y axis) for the 746 proteins, which were quantified at least once in both control sets and at least three times from eight replicates. Proteins with adjusted P value <0.01 and a fold change of two or greater were considered as “CARIC RBP.” CARIC RBPs with a fold change greater than three were classified as class I RBPs and the rest were classified as class II RBPs. (B) Molecular function GO terms enriched for the CARIC RBPs. (C) Overlap of the CARIC RBPs with the previously identified human poly(A) RBPs. (D) Overlap of the CARIC RBPs with the RBPs identified by SONAR and RBR-ID. (E) Overlap of the CARIC RBPs with the GO-annotated RBP list and the human RBP list manually curated by Gerstberger et al. (3). (F) Overlap of the CARIC RBPs with the human RBP list. Overlap of CARIC RBPs, subdivided into classes I and II, with known human RBPs is shown in Fig. S10.

