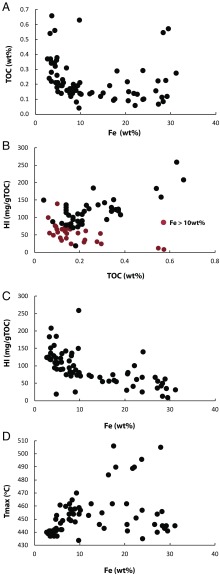
Fig. 8.
(A) Relationship between total Fe and TOC. (B) Relationship between TOC and HI for low Fe (<10 wt%; black dots) and high Fe (>10 wt%) samples from unit 5 of the Xiamaling Formation. (C) Relationship between total Fe concentration and HI for unit 5 of the Xiamaling Formation. (D) Relationship between total Fe concentration and Tmax, where Tmax is the temperature of the S2 peak maximum during Rock Eval pyrolysis.

