Fig. 3.
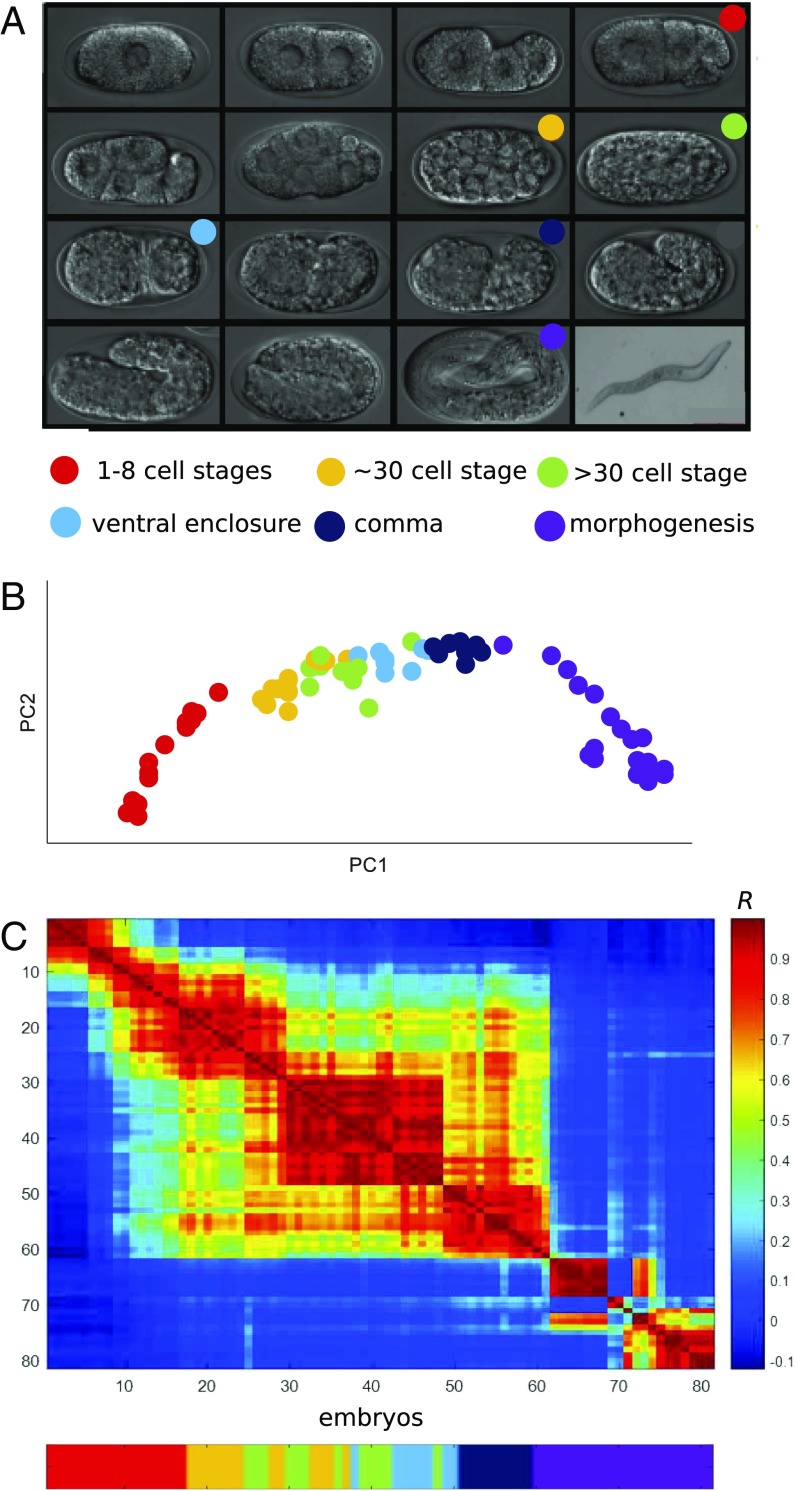
A gene expression developmental time-course for A. nanus embryogenesis. (A) Micrographs of A. nanus embryos at the indicated stages. (B) RNA-Seq of 81 randomly collected A. nanus embryos. The embryos were sorted according to BLIND. (C) A correlation matrix of the BLIND-sorted A. nanus transcriptomes. Note the sharp transitions after the one- to eight-cell stages and then again at morphogenesis.

