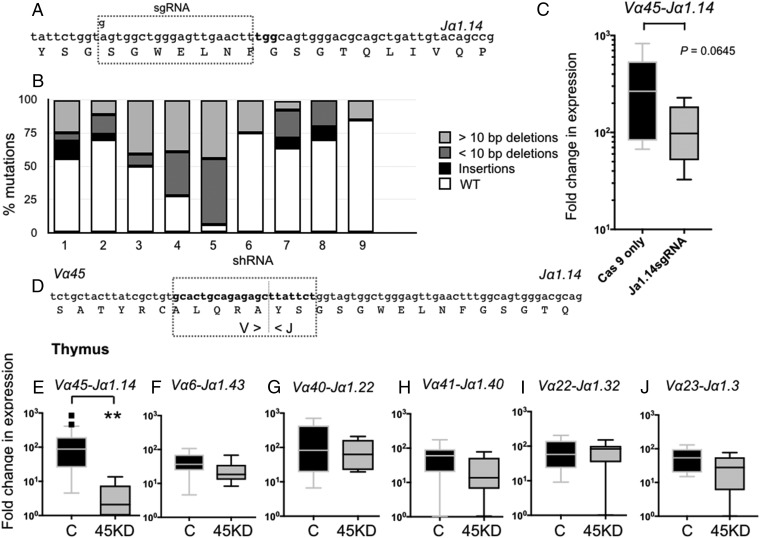
Fig. 2.
iVα45 T cell loss of function using two different reverse-genetic approaches. (A) Schematic representation showing the modified sgRNA targeting the Jα1.14 gene segment. (B) Bar graph showing the relative contributions of different types of mutations divided into insertions (black), >10-bp deletions (light gray), and <10-bp deletions (dark gray) observed among 10 randomly selected sgRNA/Cas9-treated tadpoles. Note: Multiple alignments of all mutations are shown in SI Appendix, Fig. S6. (C) Expression of the invariant Vα45-Jα1.14 transcript by qPCR in age-matched Cas9-only injected WT controls (black) and CRISPR/Cas9 Jα1.14-injected tadpoles (gray). P = 0.0645 (Student’s t test). (D) Schematic of the shRNA targeting the iVα45-Jα1.14 CDR3 region, dotted line indicates the Vα/Jα junction. Note: No n-nucleotide diversity was observed in any of the iTCR rearrangments. (E–J) Relative gene expression by qPCR in the thymus of stage 52/53 tadpoles transgenic with iVα45-Jα1.14 CDR3 KD (gray) and age-matched dejellied controls (black) for iVα45-Jα1.14 (E), iVα6-Jα1.43 (F), iVα40-Jα1.22 (G), iVα41-Jα1.40 (H), iVα22-Jα1.32 (I), and iVα23-Jα1.3 (J). Results were normalized to two endogenous controls (GAPDH and L13) and presented as fold change in expression compared with the lowest level of expression for each individual gene. All results are pools from two separate experiments and presented as individual tadpoles with the mean ± SE (n = 10–12). **P < 0.005 (one-way ANOVA test followed by a post hoc analysis using Tukey’s multiple comparisons test).

