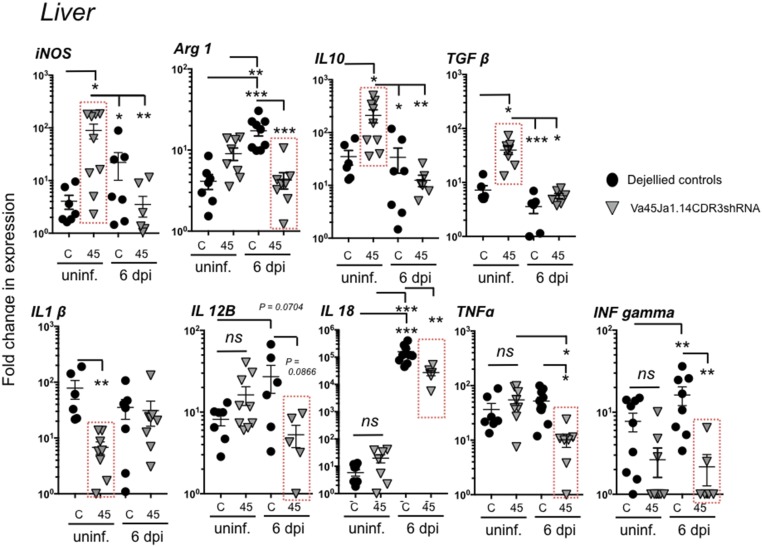
Fig. 5.
iVα45 T cell deficiency impacts cytokine expression profile in liver of Mm-infected tadpoles. Relative gene expression analysis by qPCR for inducible nitric oxide (iNOS), Arginase 1 (Arg1), interleukin 10 (IL-10), transforming growth factor β (TGFβ), interleukin 1β (IL1β), interleukin 12 (IL12-B), interleukin 18 (IL-18), tumor necrosis factor α (TNFα), and interferon gamma (IFN-γ) in liver isolated from either uninfected or Mm (300,000 cfu)-infected F0 transgenic tadpoles with KD of Vα45Jα1.14 CDR3 (gray triangles, n = 10) or age-matched dejellied control (black circles, n = 10) at 0 and 6 dpi. Gene expression was determined relative to the endogenous control GAPDH and normalized against respective uninfected gene expression. Results are representative of two independent experiments and presented with the mean ± SEM (n = 10–12). *P < 0.05, **P < 0.005, ***P < 0.0005 (one-way ANOVA test followed by a post hoc analysis using Tukey’s multiple comparisons test). ns, nonsignificant.

