Fig. 2.
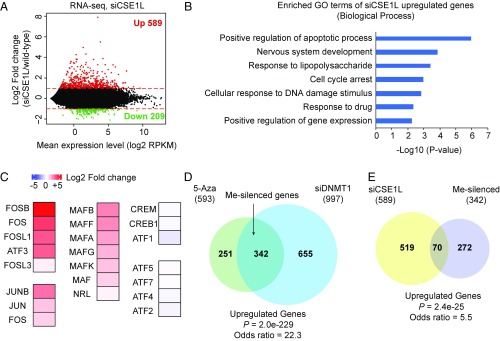
Depletion of CSE1L activates a fraction of endogenous genes silenced by DNA methylation. (A) MA plot (log ratio vs. average) showing differential gene expression in CSE1L-knockdown cells. The log2 fold change in the expression of each gene is plotted against the mean gene expression (log2 RPKM). Red dots represent genes with significantly increased expression in siCSE1L vs. wild-type cells. Green dots represent genes with significantly decreased expression in siCSE1L vs. wild-type cells. The red lines indicate the log2 fold change at 1 and −1. (B) GO-term analysis of up-regulated genes in siCSE1L-treated cells. (C) Heat-map showing the change in the expression of AP1 superfamily transcription factors in siCSE1L-treated cells. (D) Venn diagram showing the overlap of up-regulated genes in 5-Aza– and siDNMT1-treated cells (P = 2.0e-229). Me-silenced genes are the genes commonly up-regulated in 5-Aza and siDNMT1 treatments. (E) Venn diagram showing the overlap of up-regulated genes in siCSE1L-, 5-Aza–, and siDNMT1-treated cells (P = 2.4e-25).

