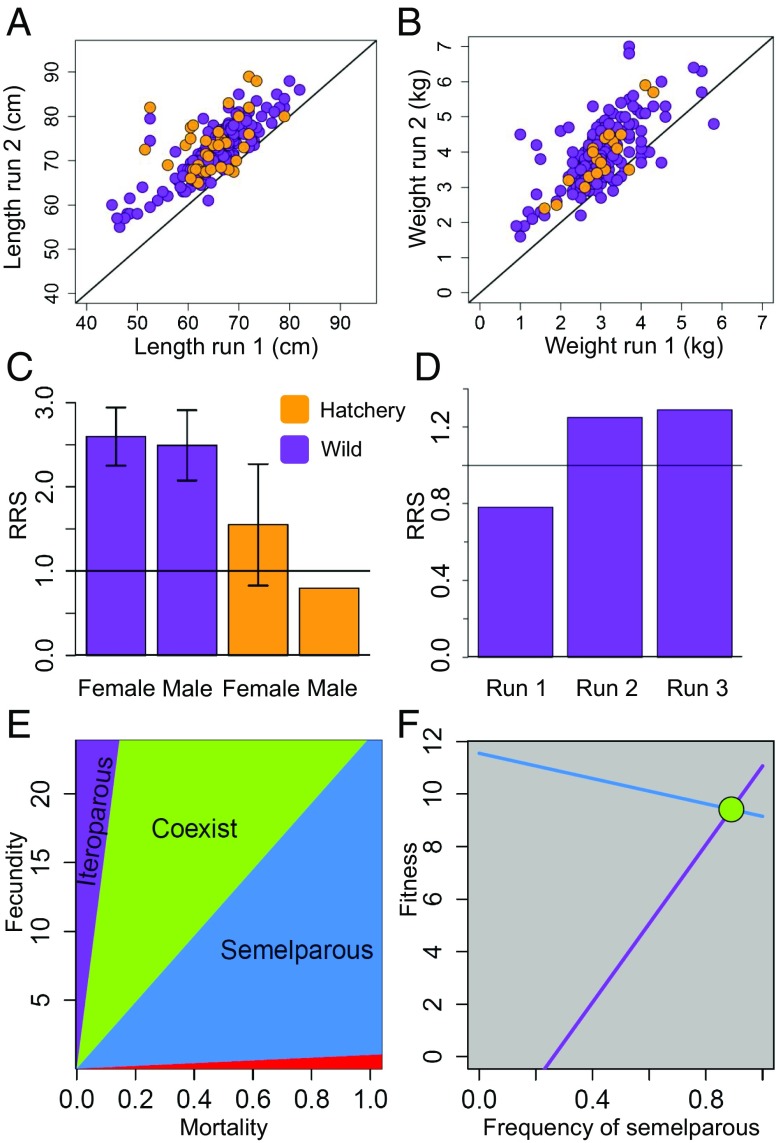
Fig. 2.
The vast majority of repeat spawners were longer and heavier the second time they spawned (A and B). There were no differences in length between hatchery repeat spawners (orange points) and wild repeat spawners (purple points). The average lifetime reproductive success for all wild repeat spawners relative to all single spawners of the same sex was 2.59 for females and 2.48 for males (C). Error bars illustrate 95% CIs. Hatchery repeat spawners had lower point estimates of RRS, but their smaller sample sizes resulted in much wider confidence intervals (not shown for hatchery males, which exceeded the y-axis scale). Females also had lower reproductive success relative to single spawners of the same age the first time they spawned (i.e., run 1), but higher RRS the second and third times they spawned (i.e., runs 2, 3) (D). Using a matrix game, we illustrate regions in fecundity-mortality space, where each strategy is the ESS (E). The semelparous strategy is shaded blue, and the iteroparous strategy is shaded purple. The region of overlap (shaded green) is the region of coexistence. The red shading demarcates where mortality exceeds fecundity, and below that line, all strategies go extinct. From the solutions in E, we can pick any point (mortality, fecundity) inside the region of coexistence and determine the fitness landscape (F). When coexistence is possible, we can plot the fitness landscape and the equilibrium frequency of each strategy (green circle).

