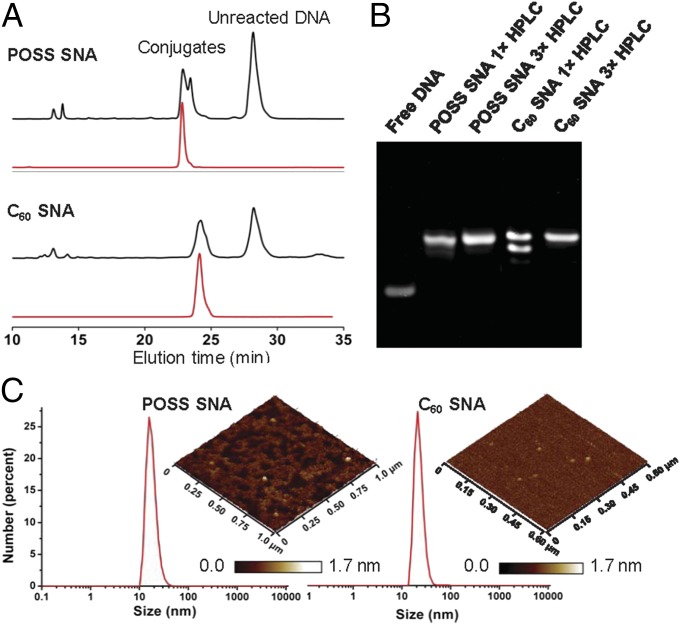
Fig. 4.
Characterization of molecular SNAs. (A) HPLC traces of the conjugation reaction mixture (black) and final purified products (red). (B) PAGE (15%) of free DNA and conjugates after 1× and 3× HPLC purification. (C) DLS size distribution by particle number. (Insets) AFM height images of the particles. The x-y scale is indicated on the sides of the images. Z-scale is shown in a scale bar below.

