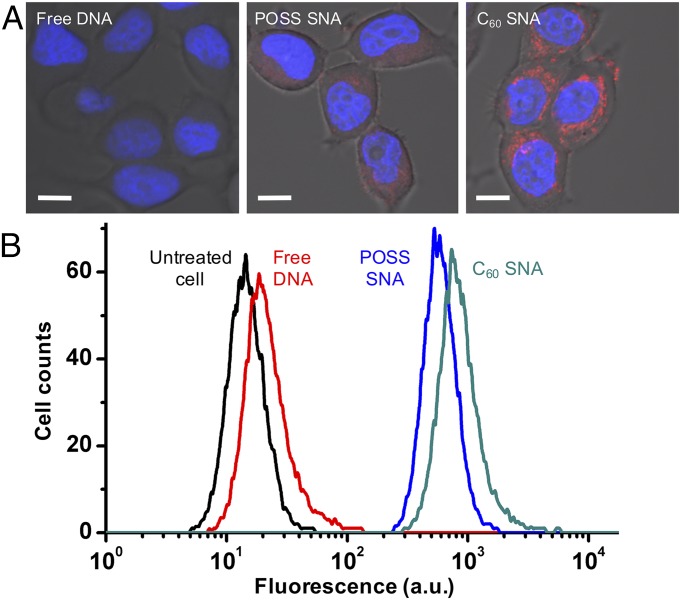
Fig. 6.
Cellular uptake of molecular SNAs. (A) Confocal microscopy of MCF7 cells treated with Cy3-labeled free DNA and conjugates (red). Cell nuclei are stained with Hoechst (blue). The cells were incubated for 6 h with samples with an equal DNA concentration of 0.5 µM in serum-free medium. (Scale bar: 10 μm.) (B) Flow cytometry measurement of MCF7 cells treated with the samples and the untreated cells.

