
Figure 3.
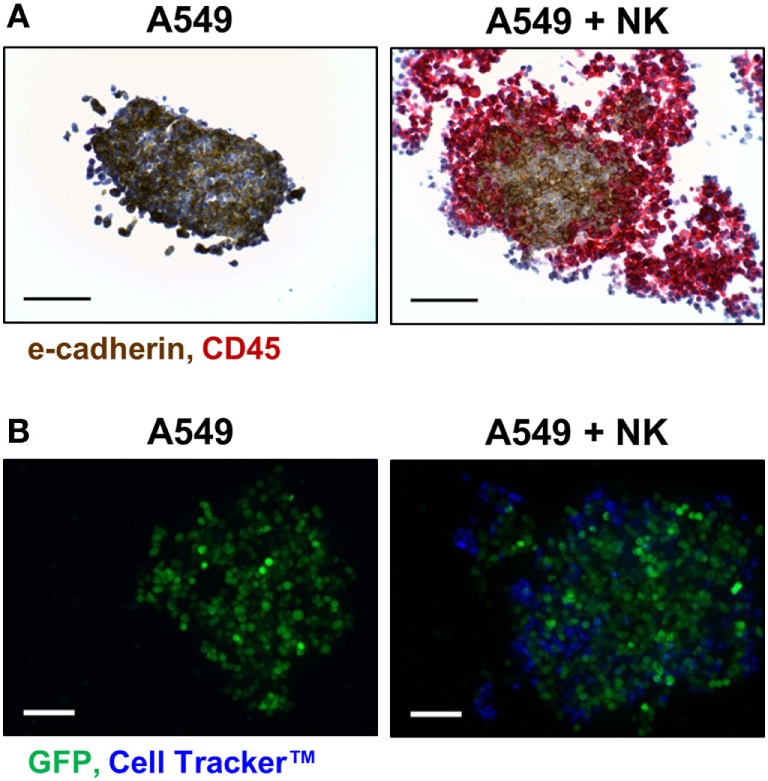
NK-92MI cell infiltration into A549/GFP tumor spheroids. (A) Representative histological sections of CD45- (red) and e-cadherin-stained (brown) of A549/GFP spheroids (left) and spheroids exposed to NK-92MI cells for 4 h (right) at 200× magnification. (B) Maximum projection confocal images of A549/GFP spheroids (green) subjected to NK-92MI cell (blue) infiltration. Images taken at 20× with a Z stack height of 125 µm via Thermo Scientific™ CellInsight™ CX7. Scale bars are 100 µm (A) and 200 µm (B).