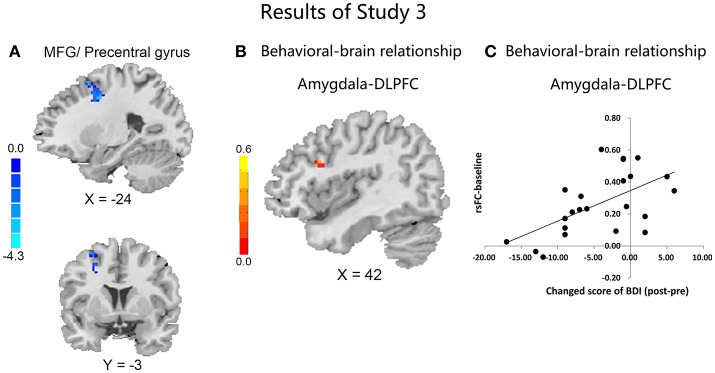
Figure 3.
Results in study 3. Comparisons of the rsFC changes ([rsFC at the second scanning]–[rsFC at baseline]) between the CBI+ and CBI− groups over the left amygdala with MFG, precentral gyrus and SFG (A); Negative association between the FC of left amygdala and right DLPFC at baseline with changed score of depression in the CBI+ group (B); Scatterplot is shown of correlation between changed score of BDI and beta values for cluster surviving in baseline rsFC of amygdala-DLPFC (C).

