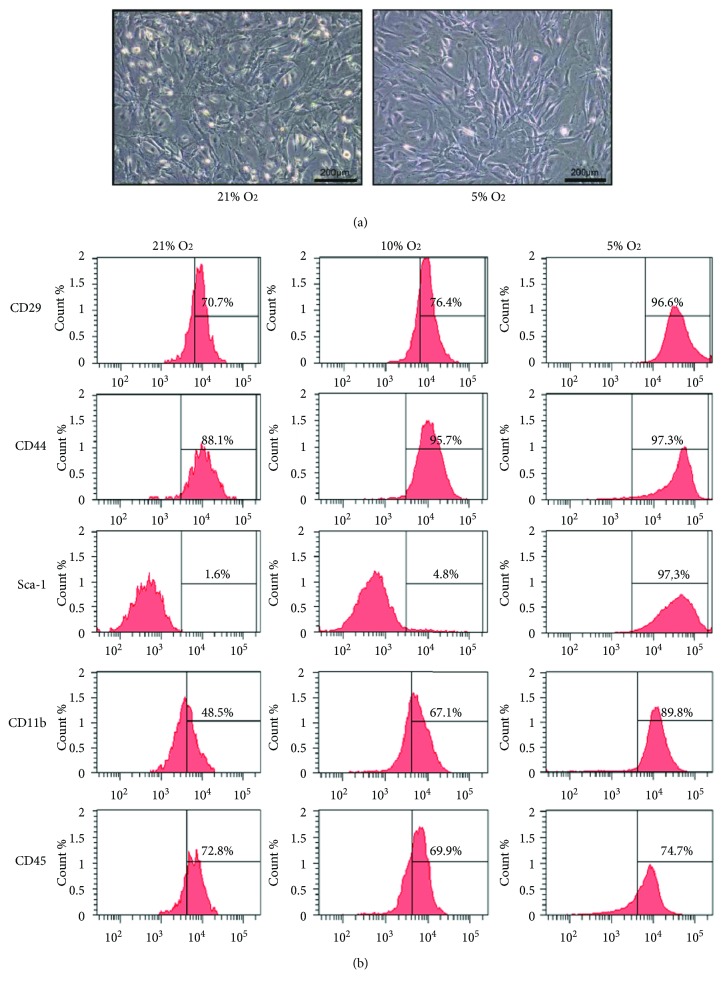
Figure 1.
Effects of various oxygen concentrations on the cellular morphology and surface markers of BM-MSCs. (a) Representative image of BM-MSCs cultured in 21% and 5% oxygen conditions (×100, scale bar = 200 μm). (b) The expression of CD29, CD44, Sca-1, CD11b, and CD45 surface markers determined by flow cytometry in BM-MSCs cultured in different oxygen concentrations (21%, 10%, and 5%).

