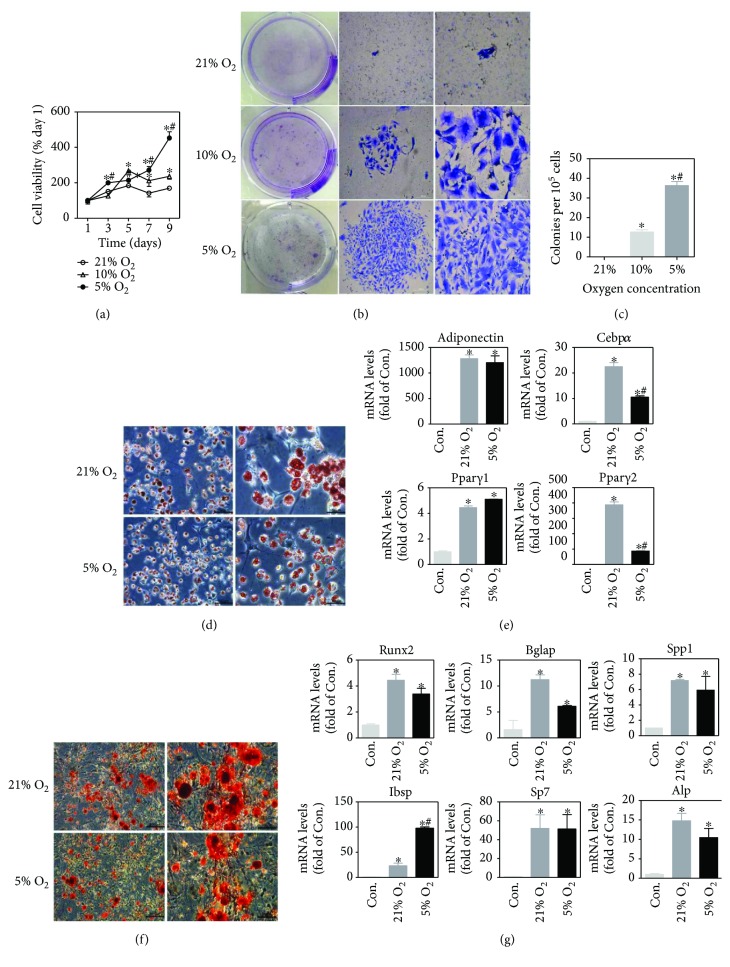
Figure 2.
The effects of oxygen concentration on proliferation capacity and differentiation potential of BM-MSCs. (a) Comparison of cell viability in different oxygen concentrations as determined by CCK8. (b) Representative images for colonies in each group in CFU assay (from left to right, the view from one well of the six-well plate, ×40 with scale bar = 500 μm, and ×100 with scale bar = 200 μm). (c) Quantification of CFU assay. Colonies with an area above 1 mm2 were counted. (d) Representative images for Oil Red O staining in 21% and 5% oxygen conditions (from left to right, ×200 with scale bar = 100 μm, ×400 with scale bar = 50 μm). (e) The expression of adipogenic differentiation-related genes of BM-MSCs after differentiation induction in 21% and 5% oxygen conditions. (f) Representative images for Alizarin Red S staining in 21% and 5% oxygen conditions (from left to right, ×100 with scale bar = 200 μm, ×200 with scale bar = 100 μm). (g) The expression of osteogenetic differentiation-related genes of BM-MSCs after differentiation induction in 21% and 5% oxygen conditions. P15 and P11 BM-MSCs were used for adipogenic and osteogenic differentiation, respectively. Results are expressed as mean ± SD from three independent measurements. ∗p < 0.05 versus Con. group; #p < 0.05 versus 21% oxygen.

