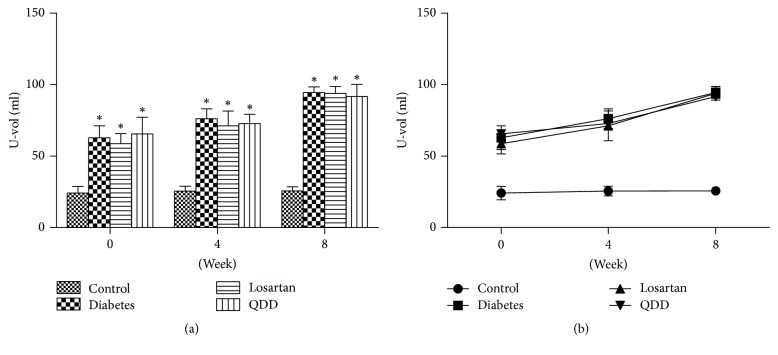
Figure 3.
Effect of QDD on U-vol of DN rats. (a) Bar graph of U-vol in four groups measured at 0, 2, 4, 6, and 8 weeks; (b) line graph of U-vol in four groups measured at 0, 2, 4, 6, and 8 weeks. Data were analyzed by one-way ANOVA followed by the least significant difference. Data were shown as mean ± SEM, n = 10 (control group) or 13 (other groups); ∗P < 0.05 versus control group; #P < 0.05 versus diabetes group.

