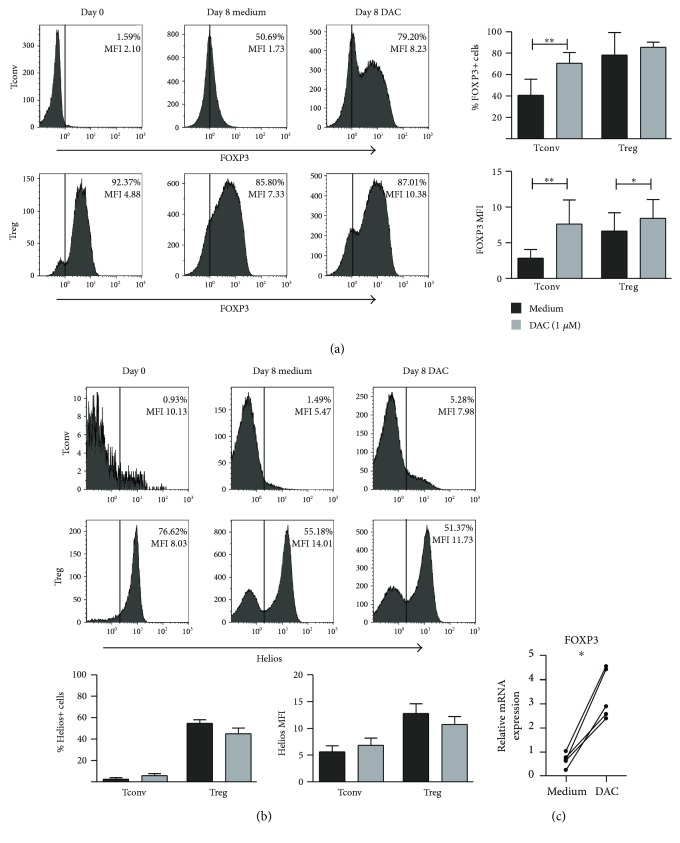
Figure 1.
Effect of DAC on FOXP3 and Helios expression of CD4+ Treg and Tconv. Flow cytometric analysis of the intracellular expression of (a) FOXP3 and (b) Helios in αCD3/αCD28+ 100U rIL-2-stimulated FACS-sorted Treg and Tconv in the absence or presence of 1 μM of DAC, at day 8 of culture. Cells were gated on the expression of CD45 and CD4. FOXP3 gate settings are based on freshly isolated Tconv and Treg. Representative histograms showing percentage positive cells (%) and median fluorescence intensity (MFI) are presented. Cumulative data presenting the percentage of positive cells and MFI of cells isolated from n = 4–7 blood donors are shown. (c) RT-qPCR analysis of FOXP3 expression in isolated CD4+ T cells stimulated with αCD3/αCD28+ 100U rIL-2 in the absence or presence of 1 μM of DAC, on day 4 of culture. The samples were normalized to the CT values of human HPRT1 (endogenous control), and 2−ΔCT values are displayed. N = 5 Wilcoxon signed-rank test, 1-tailed, ∗ p < 0.05, ∗∗ p < 0.01.

