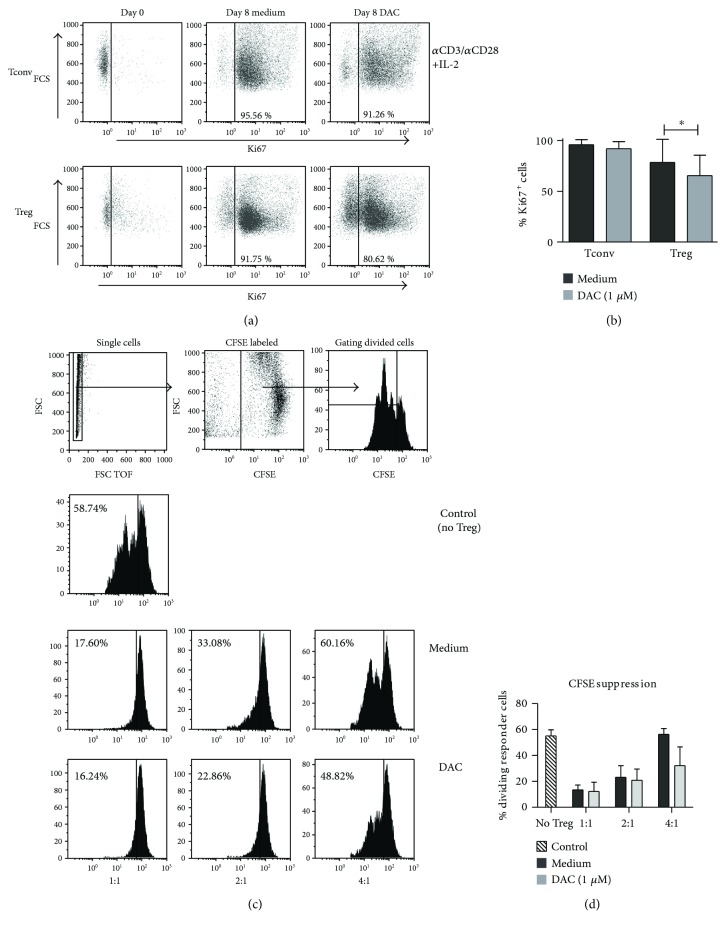
Figure 2.
Effect of DAC on proliferation and suppressive capacity of CD4+ Treg. (a) Representative dot plots, showing the expression of Ki67 in αCD3/αCD28+ 100U rIL-2 stimulated FACS-sorted Tconv and Treg at day 8 of culture. (b) Cumulative data showing the percentage of Ki67-positive cells in Tconv and Treg stimulated in the presence or absence of 1 μM DAC for 8 days (n = 7). (c) Effect of DAC on the suppressive capacity of CD4+ Treg. Flow cytometry of a CFSE-based suppression assay of αCD3/αCD28+ 100 U IL-2-stimulated Treg that were cultured for 8 days in the presence or absence of 1 μM DAC. (d) Cumulative data showing the percentage dividing responder cells in the presence of Treg with or without DAC. N = 3. Mean ± SD are shown. (b, c) Wilcoxon signed-rank test, 2-tailed, ∗ p < 0.05.

