Figure 6.
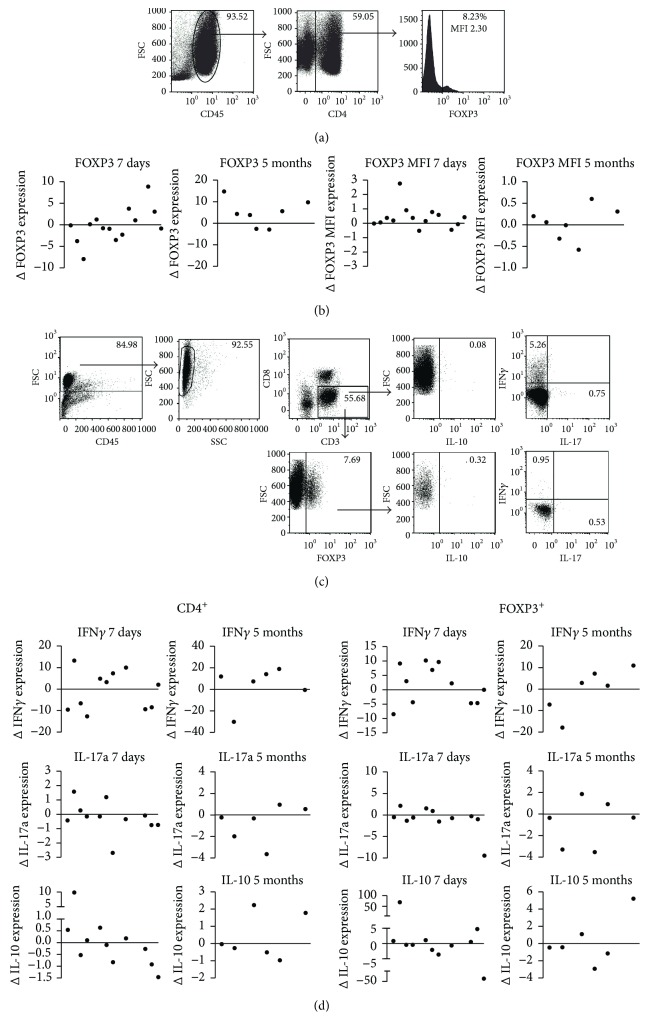
In vivo effect of Vidaza treatment on FOXP3 expression and cytokine expression by CD4 T cells. Flow cytometry of isolated PBMCs obtained from Vidaza-treated patients with hematological malignancies. (a) Gating strategy used for FOXP3 analyses. (b) Difference (Δ) in percentage FOXP3+ cells and MFI after 7 days (short term) (N = 11) and after 5 cycles (long term) (N = 7) of Vidaza. (c) Gating strategy used for cytokine analysis in CD4+ and CD4+FOXP3+ T cells after 4 h PMA/ionomycin stimulation in the presence of Brefeldin A. (d) Difference (Δ) in percentage of IFNγ, IL-17A, and IL-10 in CD4+ T cells and CD4+FOXP3+ Treg after 7 days and 5 cycles of Vidaza. Paired t-test, no significant differences.

