Figure 12.

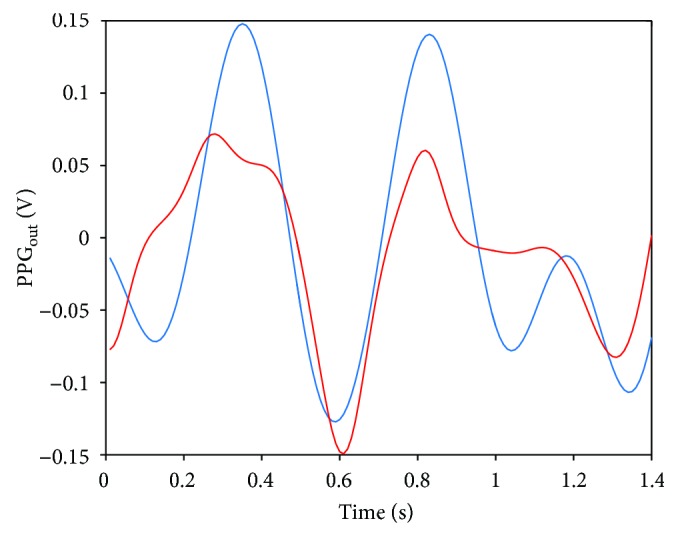
PPG output: the blue line is the raw signal filtered between 0.5 and 3.0 Hz; the red line is the PPG output after the NLMS filtering.

PPG output: the blue line is the raw signal filtered between 0.5 and 3.0 Hz; the red line is the PPG output after the NLMS filtering.