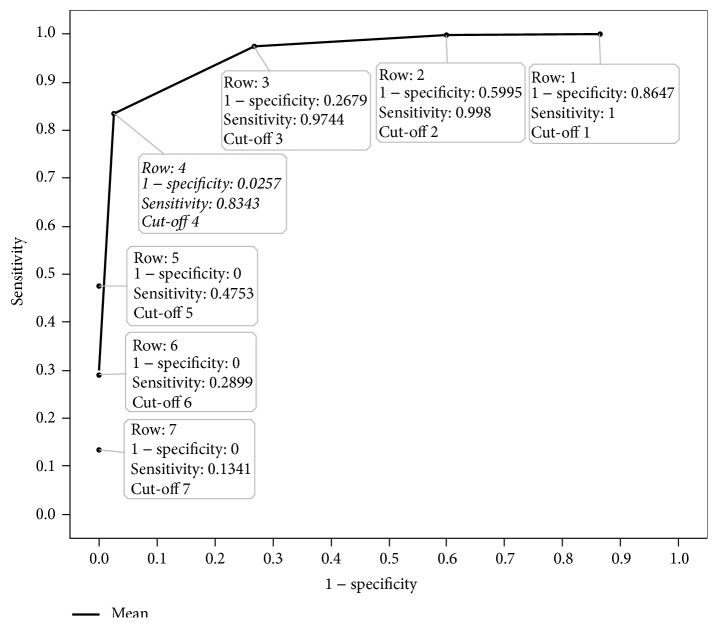
Figure 3.
Receiver Operating Characteristic (ROC) curve. The ROC curve is generated from seven different cut-off points of global scores on “shortPSQI” survey, using sensitivity (true positive) and 1 − specificity (specificity = true negative; 1 − specificity = false negative) with respect to cut-off 5 on original PSQI questionnaire. The cut-off of >4 on the global score of the “shortPSQI” demonstrates the highest sensitivity and specificity compared to the other cut-off values.

