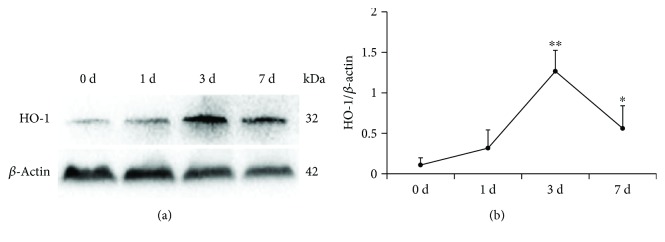
Figure 1.
HO-1 expression pattern during liver regeneration progression. (a) Protein expression and (b) quantitative data (n = 3) of HO-1 during liver regeneration were analysed at the indicated time points via western blotting after HSLT. The data represent the mean ± SD. ∗ p < 0.05, ∗∗ p < 0.01 compared to the baseline (0 d group).

