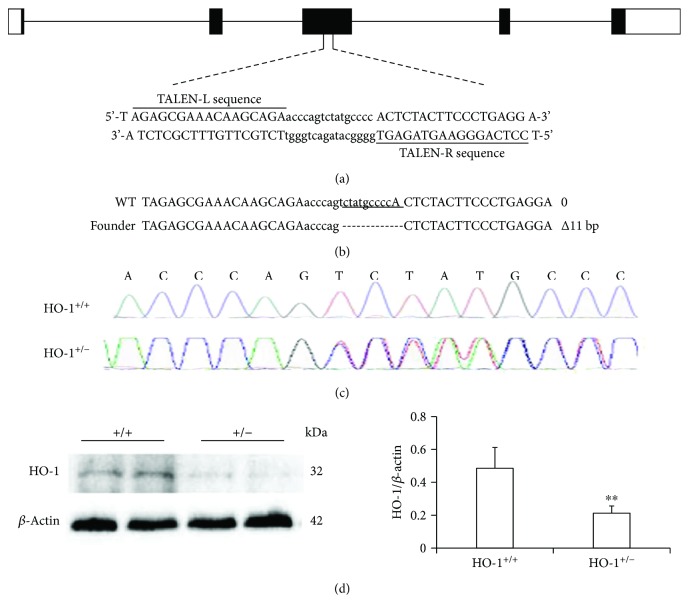
Figure 2.
Generation of HO-1-haploinsufficient (HO-1+/−) rats. (a) Schematic of the Hmox1 genetic locus and target site of TALENs. (b) Representative results of DNA sequencing from WT (+/+) and heterozygous rats (+/−). (c) Sequencing chromatograms showing the 11 bp deletion in the heterozygous (HO-1+/−) sample. (d) Representative western blots (left) and statistical analysis (right) showing HO-1 expression in WT and HO-1+/− livers under basal conditions (n = 8). The data represent the mean ± SD. ∗∗ p < 0.01.

