Figure 2.

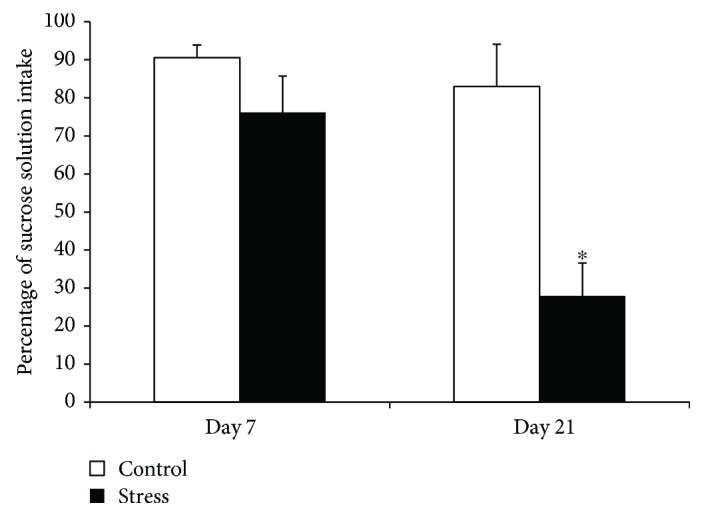
The percentage of sucrose solution intake in the control and stress groups before (day 7) and after stress (day 21). Data are expressed as the mean ± SEM. ∗p < 0.05 compared to controls.

The percentage of sucrose solution intake in the control and stress groups before (day 7) and after stress (day 21). Data are expressed as the mean ± SEM. ∗p < 0.05 compared to controls.