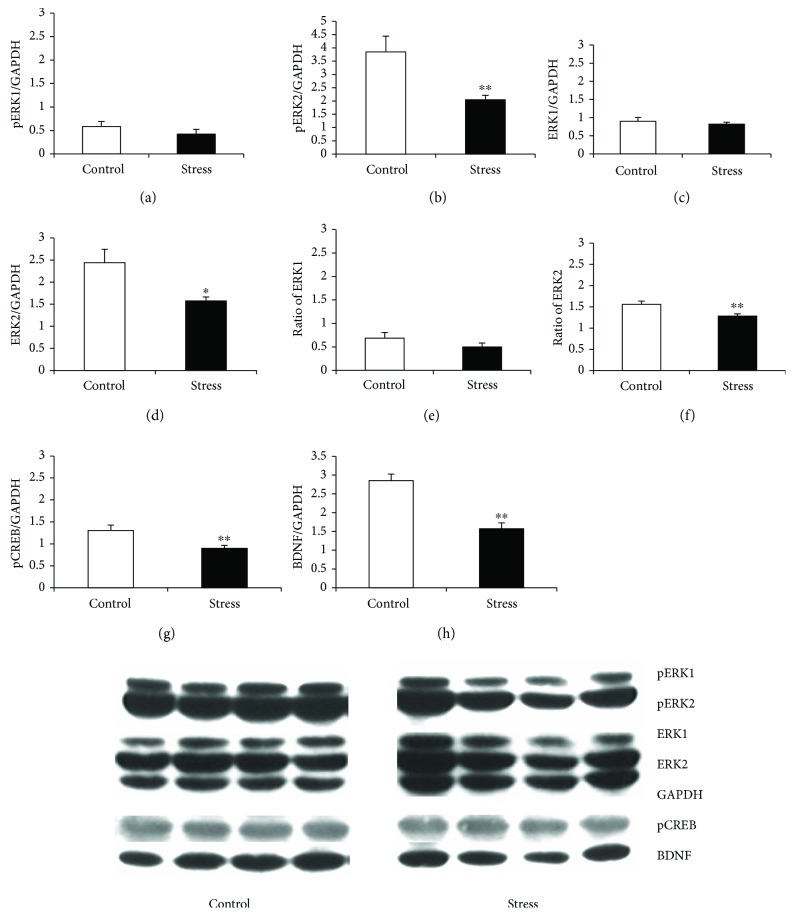
Figure 5.
The levels of pERK1 and 2, ERK1 and 2, pCREB, and BDNF and representative blots for each protein from the mPFC. (a) pERK1, (b) pERK2, (c) ERK1, (d) ERK2, (e) pERK1/ERK1, (f) pERK2/ERK2, (g) pCREB, and (h) BDNF. Data are expressed as the mean ± SEM. ∗p < 0.05 and ∗∗p < 0.01 compared to controls.

