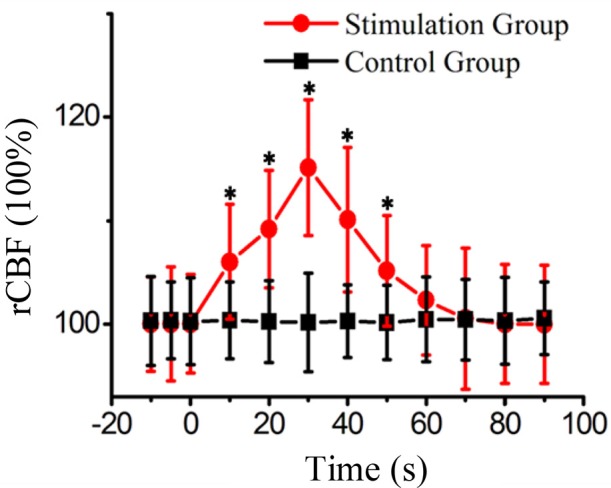
Figure 4.

The rCBF of the stimulation group and the control group at different time points from fifteen rats. (mean±S.D. paired t-test with a baseline at every imaging time point, *P < 0.05).

The rCBF of the stimulation group and the control group at different time points from fifteen rats. (mean±S.D. paired t-test with a baseline at every imaging time point, *P < 0.05).