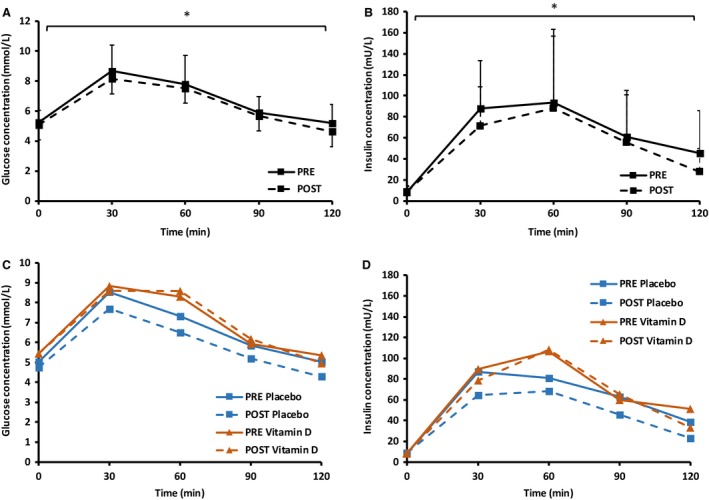
Figure 2.

Response to a 75 g OGTT at baseline and 72 h postintervention for all participants: glucose (A) and insulin (B) concentrations, and split for the placebo and vitamin D supplement group: glucose (C) and insulin (D) concentrations. *Denotes a significant difference in the oral glucose tolerance test between pre‐ and postinterventions; P < 0.05.
