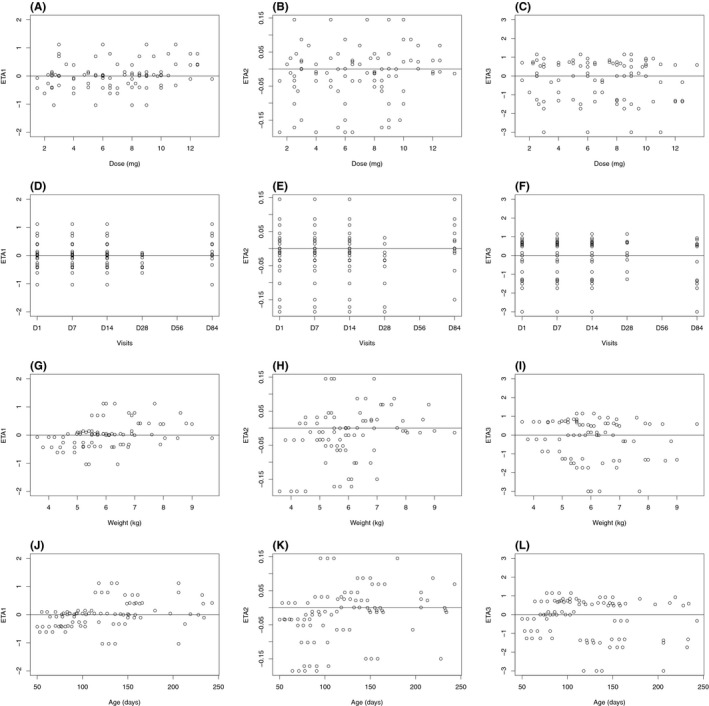
Figure 3.

Propranolol base model: distributions of inter‐individual variabilities inter‐individual variability attached to apparent plasma clearance versus dose (A) visit number or time (D) weight (G) and age (J), inter‐individual variability attached to apparent volume of distribution versus dose (B) visit number or time (E) weight (H) and age (K), interindividual variability attached to first‐order absorption versus dose (C) visit number or time (F) weight (I) and age (L)
