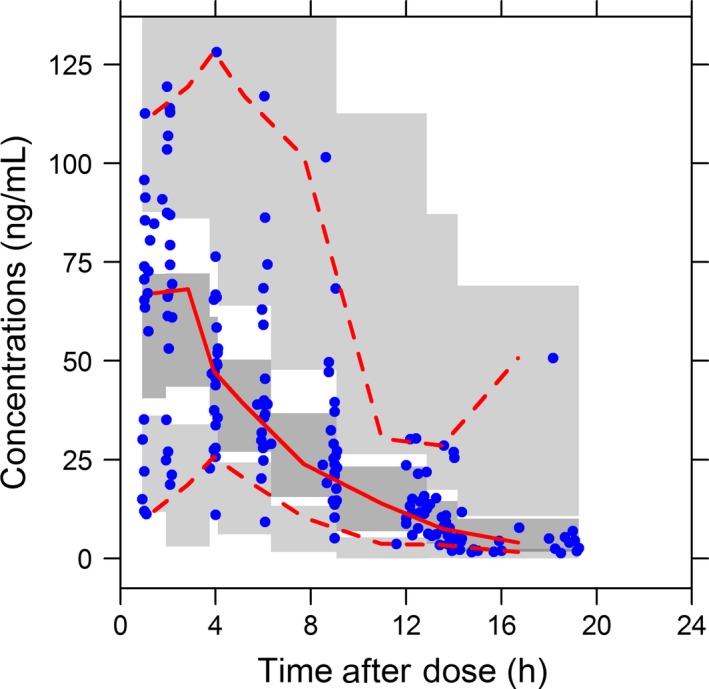
Figure 6.

Pred‐corrected VPC for the final population pharmacokinetic model for oral propranolol comparing observed to simulated propranolol concentrations as a function of time. Dots correspond to pred‐corrected observations (propranolol concentrations divided by their respective population predictions); solid lines correspond to the 2.5%, 50%, and 97.5% of pred‐corrected observations. Dark gray and light gray areas correspond, respectively, to the 95% confidence interval of median and 2.5 and 97.5% of pred‐corrected simulations
