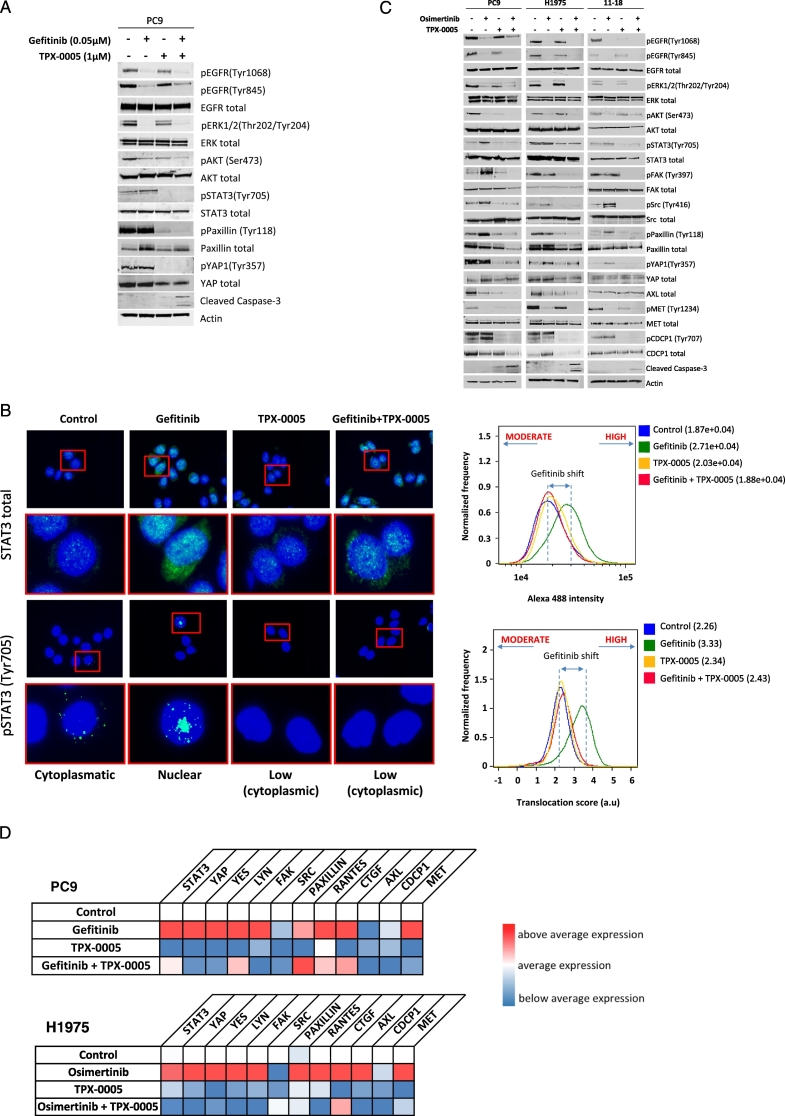
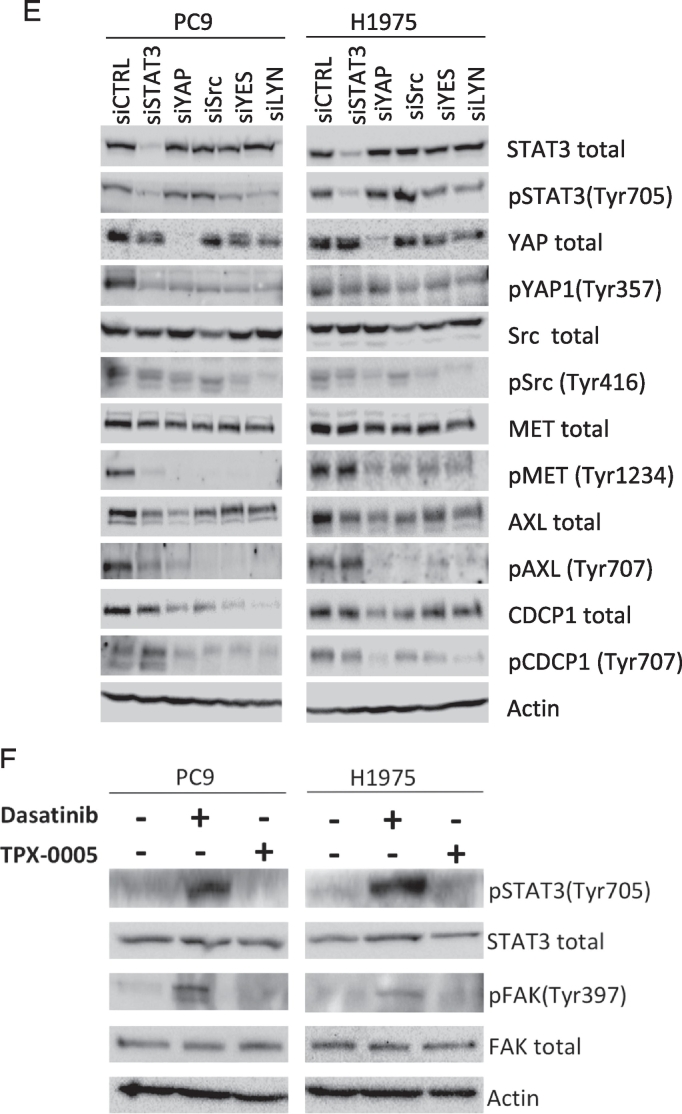
Fig. 5.
Effects of the double combination of gefitinib or osimertinib with TPX-0005 in EGFR-mutation-positive NSCLC cells. A. Extracts from the PC9 cell line treated with gefitinib (0.05 μM), TPX-0005 (1 μM), or the double combination for 24 h, were analyzed using the indicated antibodies. Similar results were obtained in three independent experiments. B. Representative immunofluorescence images showing total STAT3 and phospho-STAT3 expression and localization (green) in control, gefitinib, TPX-0005 and gefitinib plus TPX-0005 treated PC9 cells. Cell nuclei were stained with DAPI (blue). Right: expression levels and nuclear translocation of phospho-STAT3 were quantified using an ImageStreamX imaging flow cytometer. C. Extracts from PC9, 11–18 and H1975 cell lines treated with osimertinib (0.05, 0.8, and 0.02 μM respectively), TPX-0005 (1 μM), or osimertinib combined with TPX-0005 for 24 h, were analyzed by Western blotting using the indicated antibodies. β-Actin was used as a loading control. Similar results were obtained in three independent experiments. D. Heatmap depicts the mRNA expression of genes (columns) in control cells and after indicated treatments (rows) compared to the average mRNA expression of each gene in all cell lines. Gefitinib was used at 0.05 μM for PC9, osimertinib was used at 0.02 μM for H1975 and TPX-0005 was used at 1 μM for both cell lines. Quantitative RT-PCR time course experiments from two hours to seven days identified five days as the optimal time-point to compare pathway signaling after treatments (data not shown) and subsequent mRNA expression experiments are presented at this time point for consistency. Data were generated from a minimum of three replicates. β-Actin was used to normalize gene expression. E. Extracts from the PC9 and H1975 cell lines transfected with control siRNA or siRNA against STAT3, Src, YAP1, YES and LYN, were analyzed using the indicated antibodies. Similar results were obtained in three independent experiments. F. Extracts from the PC9 and H1975 cell lines treated with dasatinib (50 and 100 μM respectively) or TPX-0005 (1 μM) for 24 h, were analyzed by Western blotting using the indicated antibodies. Similar results were obtained in three independent experiments.


