FIGURE 2.
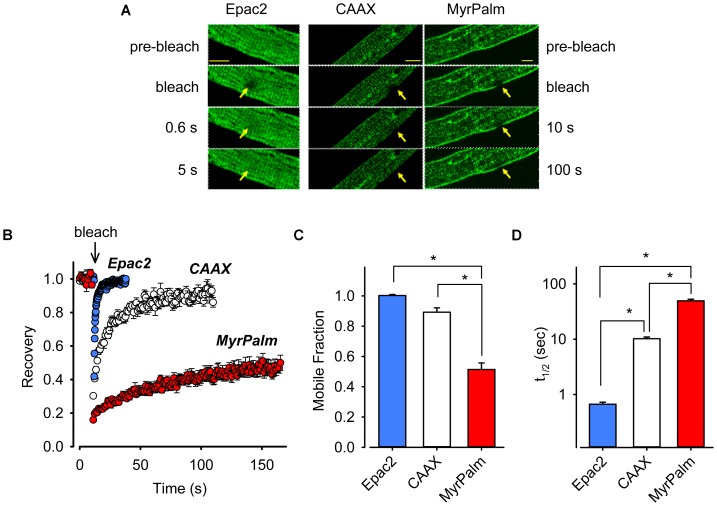
Biosensors targeted to different subcellular locations of cardiac ventricular myocytes exhibit varying mobilities. (A) Images from FRAP experiments in adult rat ventricular myocytes expressing Epac2-camps (Epac2, left panels), Epac2-CAAX (CAAX, middle panels), or Epac2-MyrPalm (MyrPalm, right panels). Images were taken before and at various time points after bleaching of a circular area of 5 μm in diameter (arrows). Images were captured at a greater frequency for freely diffusible Epac2 (indicated by faster recovery on the left) as compared to membrane targeted biosensors CAAX and MyrPalm (indicated by slower recovery on the right). Scale bar: 10 μm. (B) Time course of fluorescence recovery from photobleaching from FRAP experiments in cells expressing Epac2 (blue circles), CAAX (white circles), or MyrPalm (red circles). Summary of (C), mobile fraction (Mf), and (D) fluorescence recovery half-time (t1/2), in cells expressing Epac2-camps (n/N = 15/4, blue bars), Epac2-CAAX (n/N = 7/3, white bars) or Epac2-MyrPalm (n/N = 8/3, red bars). ∗p < 0.001, Kruskal–Wallis one-way ANOVA on Ranks followed by Dunn’s test for pairwise multiple comparisons.

