FIGURE 3.
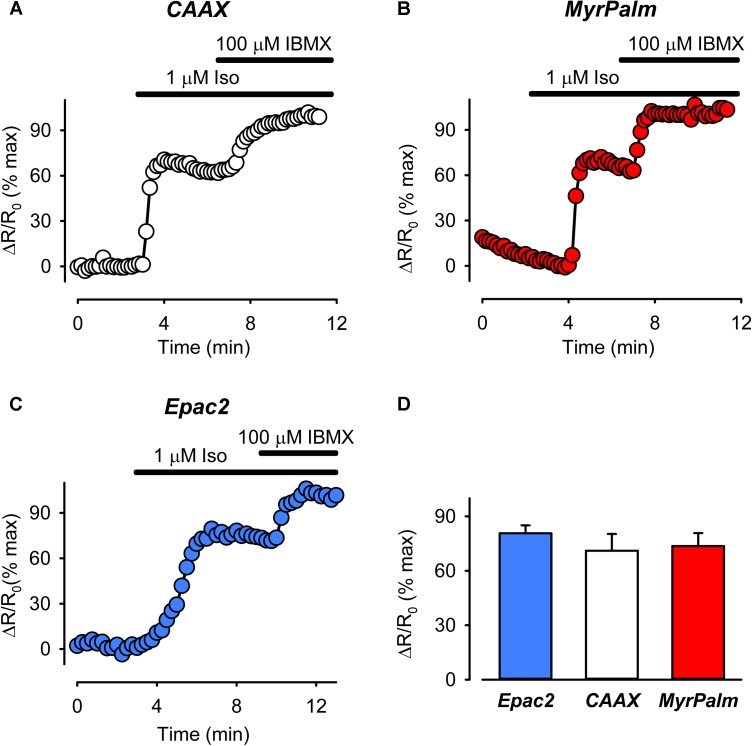
The magnitude of cAMP responses detected by biosensors targeted to different subcellular locations are similar following treatment with the βAR agonist isoproterenol (Iso). (A–C) Representative time course of changes in the normalized FRET response (ΔR/R0) in cells expressing Epac2-CAAX (CAAX, white circles), Epac2-MyrPalm (MyrPalm, red circles), and Epac2-camps (Epac2, blue circles), under control conditions, and following exposure to 1 μM Iso, and 1 μM Iso plus 100 μM IBMX. (D) Summary of average FRET responses to 1 μM Iso in cells expressing Epac2-camps (n/N = 8/6, blue bar), Epac2-CAAX (n/N = 10/5, white bar), and Epac2-MyrPalm (n/N = 14/5, red bar). Responses to 1 μM Iso were not significantly different between the probes (one-way ANOVA).

