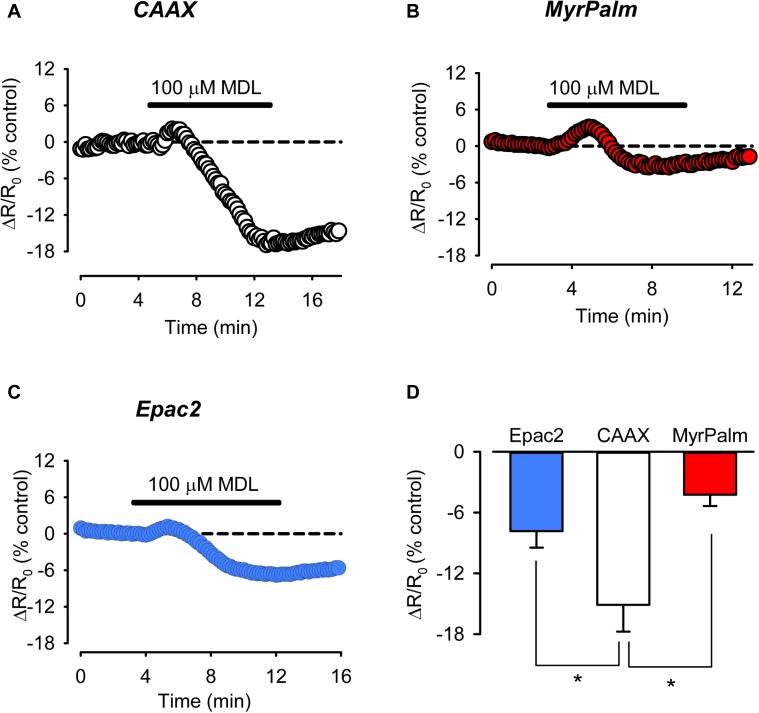
FIGURE 5.
Inhibition of basal AC activity leads to greater reduction of cAMP activity in non-raft associated membrane domains. (A–C) Representative time course of changes in the FRET response (ΔR/R0) in cells expressing Epac2-CAAX (CAAX, white circles), Epac2-MyrPalm (MyrPalm, red circles), and Epac2-camps (Epac2, blue circles), under control conditions and following exposure to the AC inhibitor MDL12330A (MDL; 100 μM). (D) Summary of average FRET responses to 100 μM MDL in cells expressing Epac2-camps (n/N = 11/5, blue bar), Epac2-CAAX (n/N = 10/6, white bar), and Epac2-MyrPalm (n/N = 7/3, red bar). Epac2-CAAX response to 100 μM MDL was significantly different from Epac2-camps and Epac2-MyrPalm responses (∗p < 0.05, Kruskal–Wallis one-way ANOVA on Ranks followed by Dunn’s test for pairwise multiple comparisons). Reference line (dotted) at zero has been added for clarity.

