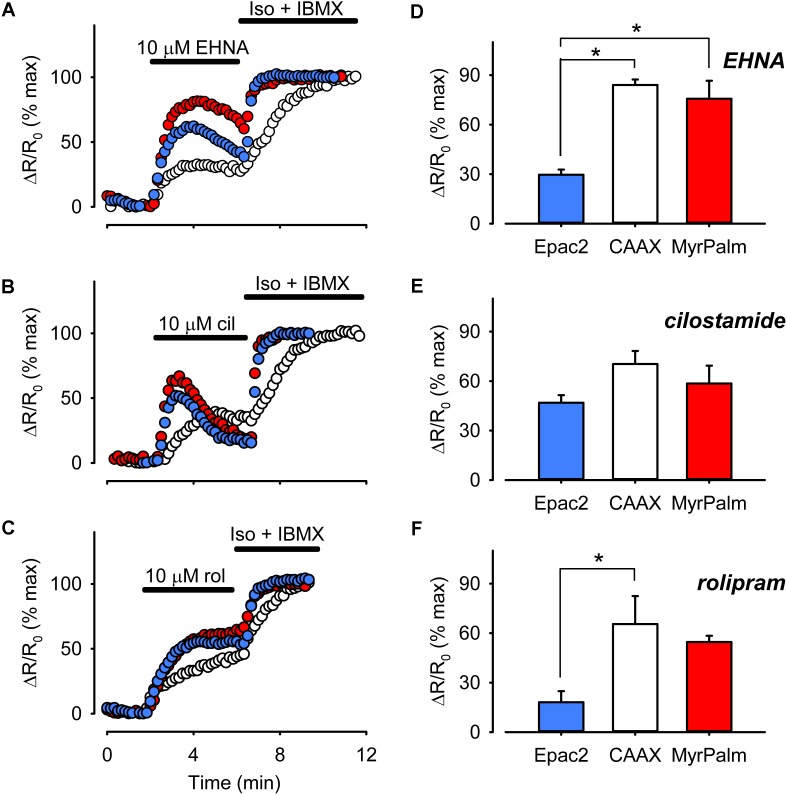
FIGURE 7.
Differential PDE activity is associated with different microdomains. (A–C) Representative time course of changes in the magnitude of the normalized FRET response (ΔR/R0) recorded in cells expressing Epac2-camps (Epac2, blue circles), Epac2-CAAX (CAAX, white circles), and Epac2-MyrPalm (MyrPalm, red circles) under control conditions and following exposure to the selective PDE2 inhibitor EHNA (A), the selective PDE3 inhibitor cilostamide (B), or the selective PDE4 inhibitor rolipram (C). The maximal response was elicited by subsequent exposure to 1 μM Iso plus 100 μM IBMX (Iso + IBMX). (D–F) Comparison of average changes in normalized FRET responses detected by Epac2-camps (blue bars), Epac2-CAAX (white bars), and Epac2-MyrPalm (red bars) following treatment with 10 μM EHNA (n/N = 5/3, Epac2; 5/3, CAAX; 5/3, MyrPalm; D), 10 μM cilostamide (n/N = 6/4, Epac2; 7/3, CAAX; 6/3, MyrPalm; E), or 10 μM rolipram (n/N = 6/4, Epac2; 5/3, CAAX; 6/3, MyrPalm; F) (∗p < 0.05, Kruskal–Wallis one-way ANOVA on Ranks followed by Dunn’s test for pairwise multiple comparisons).

