Figure 1.

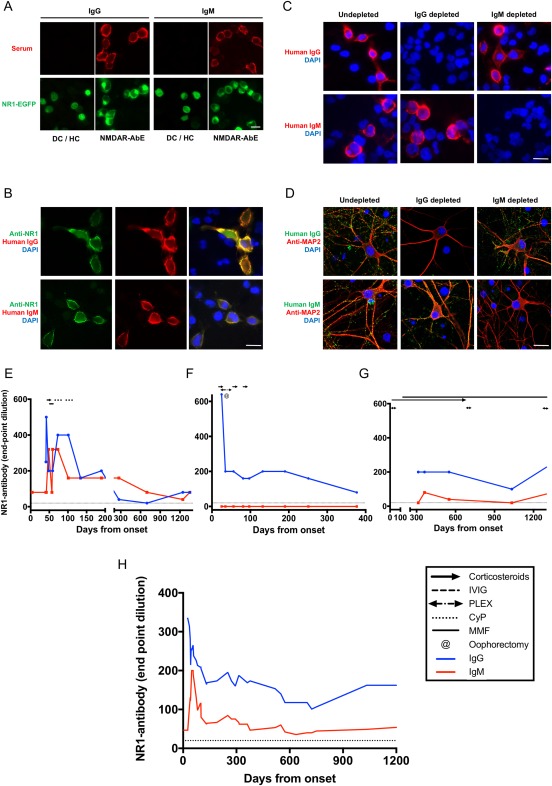
NR1‐subunit–specific IgG and IgM antibodies. (A) Live cell‐based assays expressing surface NR1/enhanced green fluorescent protein (EGFP) as a fusion protein (green), as described previously.2 IgG and IgM antibodies were detected among patients with NMDAR‐antibody encephalitis (NMDAR‐AbE; 1:20 serum dilution, red). One of 116 of the disease controls (DC) and healthy controls (HC) showed NR1‐IgM antibodies. No DC/HC showed NR1‐IgG. Scale bar, 10 μm. (B) Both NR1‐reactive IgM and IgG (red) colocalized well with an anti‐NR1 commercial antibody (green). Scale bar, 10 μm. (C) NR1‐IgM reactivity was specifically depleted with anti‐IgM precipitation, whereas protein G depletion of IgG abrogated all NR1‐IgG binding in live NR1‐expressing HEK cells. Scale bar, 10 μm. (D) Similarly, these reciprocal serum depletions confirmed specificity of both high‐titer NR1‐specific IgM and IgG antibodies which bound the surface of live hippocampal neurons (microtubule associated protein 2, MAP2, in red). Scale bar, 20 μm. Depletion was > 99%. (E–G) are representative figures of three observed trends in individual patients, and dotted line at serum dilution of 1:20 indicates cutoff for positivity. IgG is represented in blue and IgM in red, throughout. (E) Two of 10 patients showed parallel reductions of both NR1‐IgM and NR1‐IgG. (F) Four of 10 patients had NR1‐IgG without NR1‐IgM. (G) Four of 10 showed low‐level sustained fluctuations in NR1‐IgM levels. (H) Overall, the mean serum NR1‐IgM and IgGs of the 6 patients with NR1‐IgM were compared by end‐point dilutions. Values of neighboring points were used to smooth data (GraphPad Prism v7; 0th order polynomial). CyP = cyclophosphamide; DAPI = 4',6‐diamidino‐2‐phenylindole; Ig = immunoglobulin; IVIG = intravenous immunoglobulin; MMF = mycophenolate mofetil; NMDAR = N‐methyl‐D‐aspartate receptor; PLEX = plasma exchange.
