FIGURE 9.
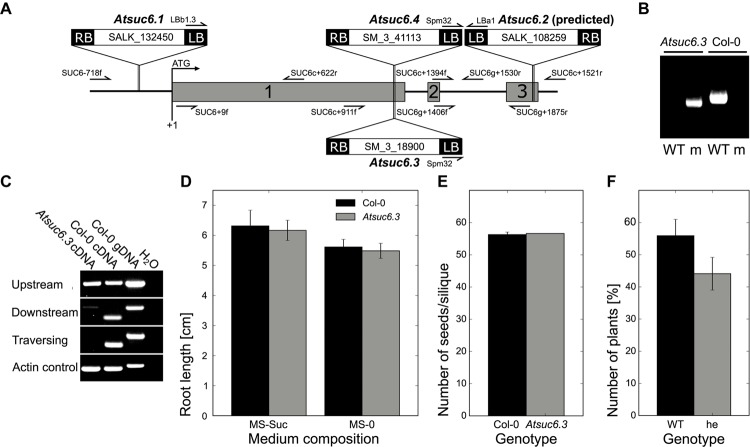
Identification and characterization of Atsuc6 T-DNA insertion lines. (A) Genomic organization of AtSUC6. Introns and untranslated regions are shown as black lines; exon regions containing coding sequences are represented by numbered gray bars. Arrows indicate the primers used for PCRs shown in (B,C). The positions of the T-DNA insertions Atsuc6.1–Atsuc6.4 are marked. LB, left border; RB, right border. (B) PCR products obtained from genomic DNA preparations of homozygous Atsuc6.3 and WT plants with primer combinations for the detection of wild type (WT) and the mutant allele (m). For primer combinations see Supplementary Table 2. (C) RT-PCR analyses of RNA obtained from flowers of a homozygous Atsuc6.3 mutant plant and a WT plant with primers amplifying either the AtSUC6 sequence traversing, upstream of or downstream of the insertion (Supplementary Table 3). WT genomic DNA was used as control for contaminations with genomic DNA. (D) Length of main roots of 14-day-old Atsuc6.3 and WT seedlings on MS-0 or MS medium supplemented with 2% (w/v) sucrose. Means of three biological replicates ± SD are shown. n > 30 for each genotype. (E) Average number of seeds/silique ± SD of Atsuc6.3 and WT plants after self-pollination. n > 50 siliques/genotype. (F) Genotypes of F1 descendants of a cross-pollination experiment with heterozygous Atsuc6.3/AtSUC6 pollen and pistils from a WT plant. Bars represent mean values (±SE) of WT and heterozygous plants in the F1 generation resulting from eight independent crossings (n = 76 in total).

