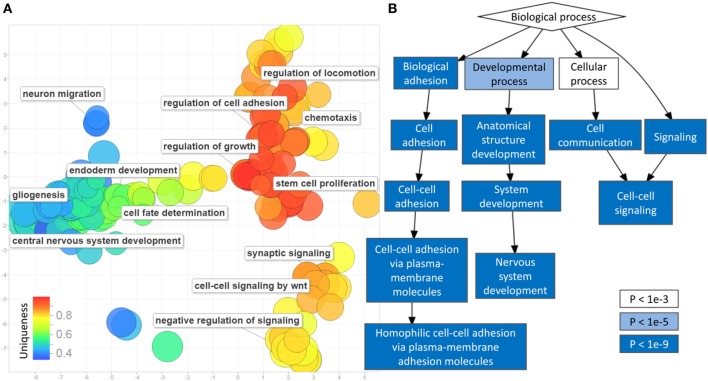
Figure 2.
Gene-set enrichment analysis of differentially methylated cytosine-phosphate-guanine sites (CpGs) in prostate cancer: (A) multiple dimensional scaling of the gene ontology (GO) terms (circles): GO terms with closely related functionalities are clustered in groups. Circles with smaller distance from each other represent GO terms with similar functionality. The uniqueness of every GO term is shown using a color scale from blue (less unique) to red (more unique). Representative non-redundant GO terms from every cluster are written next to the related circles. Only 350 of the GO terms were selected by REVIGO for reduction and visualization (maximum software limit); (B) hierarchical relationship between the significant GO terms: the level of significance (p-value) of every functional category is illustrated by a color scale from white to blue.

