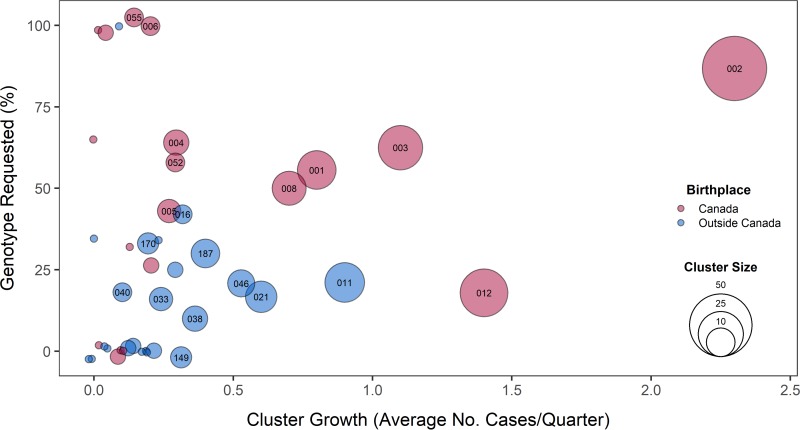
FIG 1.
Bubble plot of the proportion of each cluster requested for genotyping to confirm or refute transmission, with the average cluster growth per quarter in BC from 2009 to 2013. Growing clusters had a minimum of three persons in the cluster over the study period. Bubbles are colored to indicate the predominant birthplace (≥50%) of the individuals in each cluster and sized to represent the total number of genotypically clustered cases. Cluster identifiers are indicated for clusters with five or more patients.

