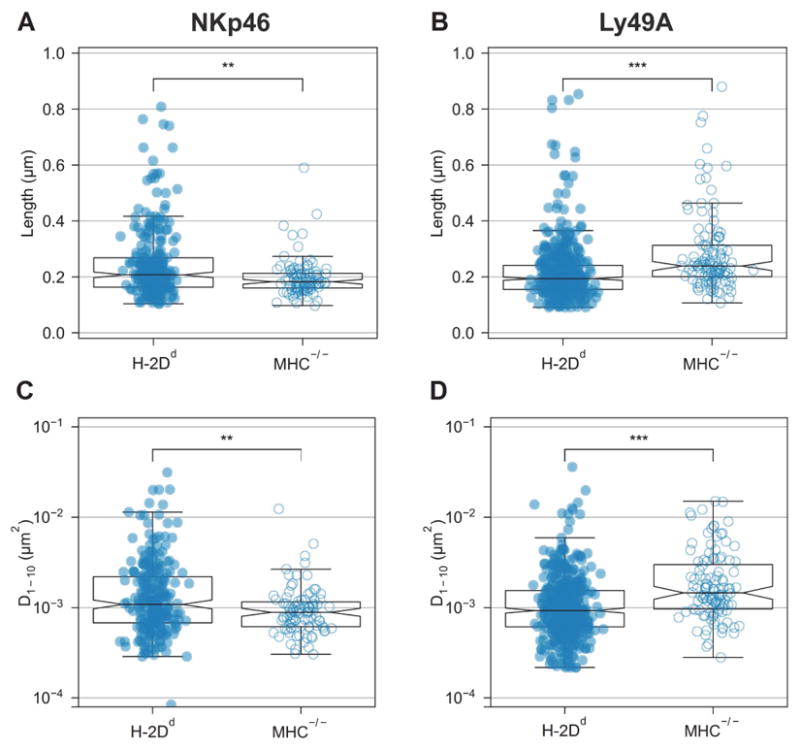
Fig. 2. NKp46 diffuses faster and cover larger areas on educated NK cells, whereas Ly49A diffuses slower and cover smaller areas in educated NK cells.

Single particle tracking (SPT) trajectories in freshly isolated H-2Dd compared to MHC−/− murine NK cells captured at 20 ms frame-to-frame rate. Each dot represents a single trajectory. (A–B) NKp46 microdomain median width: H-2Dd = 0.21, MHC−/− = 0.18 μm (A) and Ly49A microdomain median width: H-2Dd = 0.19 and MHC−/− = 0.24 μm (B). (C–D) NKp46 short range diffusion coefficient D1-10 median: H-2Dd = 1.1*10−3 and MHC−/− = 0.89*10−3 μm2/s (C) Ly49A short range diffusion coefficient D1-10 median: H-2Dd = 0.93*10−3 and MHC−/− = 1.5*10−3μm2/s (D). The tracks are the same as those depicted in Fig. 1. The boxes represent medians (line inside box), the 95 % confidence intervals (notches), first and third quartiles (end of boxes), and the whiskers 1.5 times the interquartile ranges. P-values: ** ≤ 0.01, *** ≤ 0.001 (two-sample Wilcoxon ranking test).
