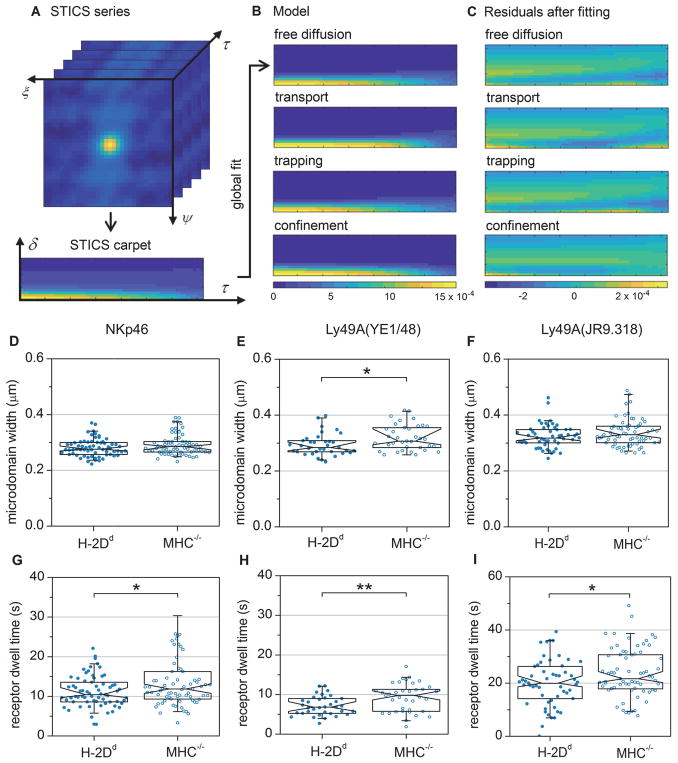
Fig. 3. iMSD carpet analysis reveals a smaller Ly49A domain size and shorter average microdomain dwell times for NKp46 and Ly49A in educated NK cells compared to hyporesponsive NK cells.
(A) The three-dimensional STICS series was calculated from a recorded image time series, followed by conversion into a two-dimensional carpet by combining the spatial lags, ξ and ψ, into a single radial component, δ. (B) The data was fitted with four models representing different types of particle dynamics. Panes show the fitted models of a sample data set. (C) The residuals of the fit of each model for the sample data set shown in (B). The color scale in B and C represents the correlation amplitude. (D–I) TIRF imaging and fitting of the confinement carpet iMSD model to freshly isolated Ly49A+ NK cells. The graphs show analyses of microdomain widths of (D) NKp46, (E) Ly49A (labelled with antibody YE1/48), and (F) Ly49A (labelled with antibody JR9.318). (G–I) Receptor dwell times within individual domains of (G) NKp46, (H) Ly49A (labelled with antibody YE/148), and (I) Ly49A (labelled with antibody JR9.318). Each dot represents one cell, N=67 for NKp46 in H-2Dd cells, 72 for NKp46 in MHC−/− cells, 53 for Ly49A in H-2Dd cells, 68 for Ly49A in MHC−/− cells (JR9.318), 35 for Ly49A in H-2Dd cells and 37 for Ly49A in MHC−/− cells (YE/148). Data were pooled from six (NKp46 antibody and JR9.318) or three (YE1/48) independent experiments. No more than one outlier per sample was excluded prior to analysis, using Grubbs’ test. The boxes represent median, first and third quartiles; the notch represent the 95 % confidence intervals. The whiskers show the 95 % ranges. P-values: * ≤ 0.05, ** ≤ 0.01 (Mann-Whitney’s test). Comparisons that are not marked were not statistically significantly different.

