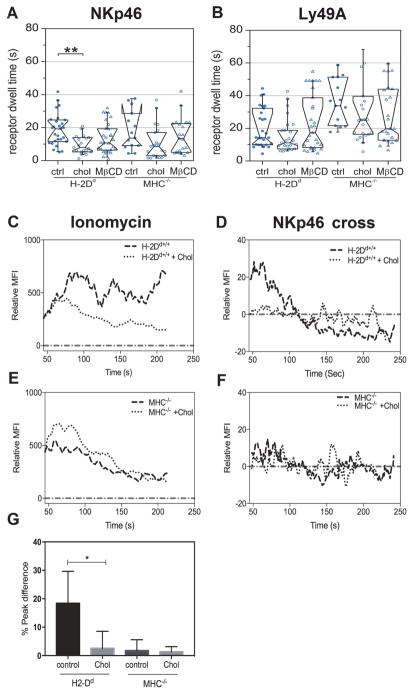
Fig. 5. The role of cholesterol in receptor dynamics and signal initiation.
(A) NKp46 microdomain dwell time and (B) Ly49A microdomain dwell time, as detected by antibodies (clone JR9), after adding cholesterol (chol), depleting cholesterol with methyl-β-cyclodextrin (MβCD), or in untreated control cells (ctrl). MFI= Mean Fluorescence Intensity. Each dot represents one cell. N= 27 H-2Dd ctrl, 21 H-2Dd chol, 29 H-2Dd MβCD, and 14 MHC−/− ctrl, 21 MHC−/− chol, 21 MHC−/− MβCD (A); N=27 H-2Dd ctrl, 24 H-2Dd chol, 28 H-2Dd MβCD, and 14 MHC−/− ctrl, 23 MHC−/− chol, 25 MHC−/− MβCD (B). Data were pooled from three independent experiments. No more than one outlier per group was detected and removed using Grubbs’ test. The boxes represent medians, first and third quartiles, the notches represent the 95 % confidence intervals. The whiskers show the 95 % range. P-values: * ≤ 0.05 (Mann-Whitney’s test). (C–F) representative Fluo-4 fluorescence time traces indicating Ca2+ release in H-2Dd and MHC−/− NK cells after stimulation with ionomycin (C, E) or crosslinking of NKp46 (D, F) normalized to median base line by subtraction, in the absence or presence of added cholesterol (+chol). Statistical tests were performed between control groups and treatment within each mouse (H-2Dd ctrl versus H-2Dd treated and MHC−/− ctrl versus MHC−/− treated); differences not marked in the figure were not statistically significantly different.

