
FIGURE 2.
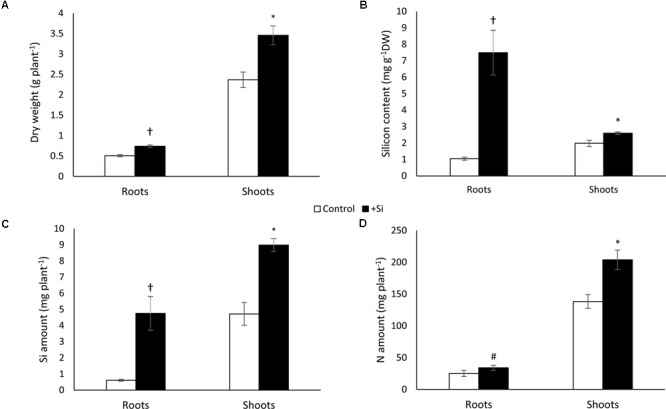
Dry weight (A), total silicon amount (B), silicon content (C) and total nitrogen amounts (D) in shoots and roots of Brassica napus L. at the end of the Si pretreatment (Day 0). This harvest time (Day 0) corresponds to the end of the pretreatment period of plants with (+Si) or without Si (–Si; Control). Data are means ± SE (for n = 4). ∗ and † indicate significant differences between –Si (control) and +Si plants with p < 0.05 and p < 0.001, respectively.