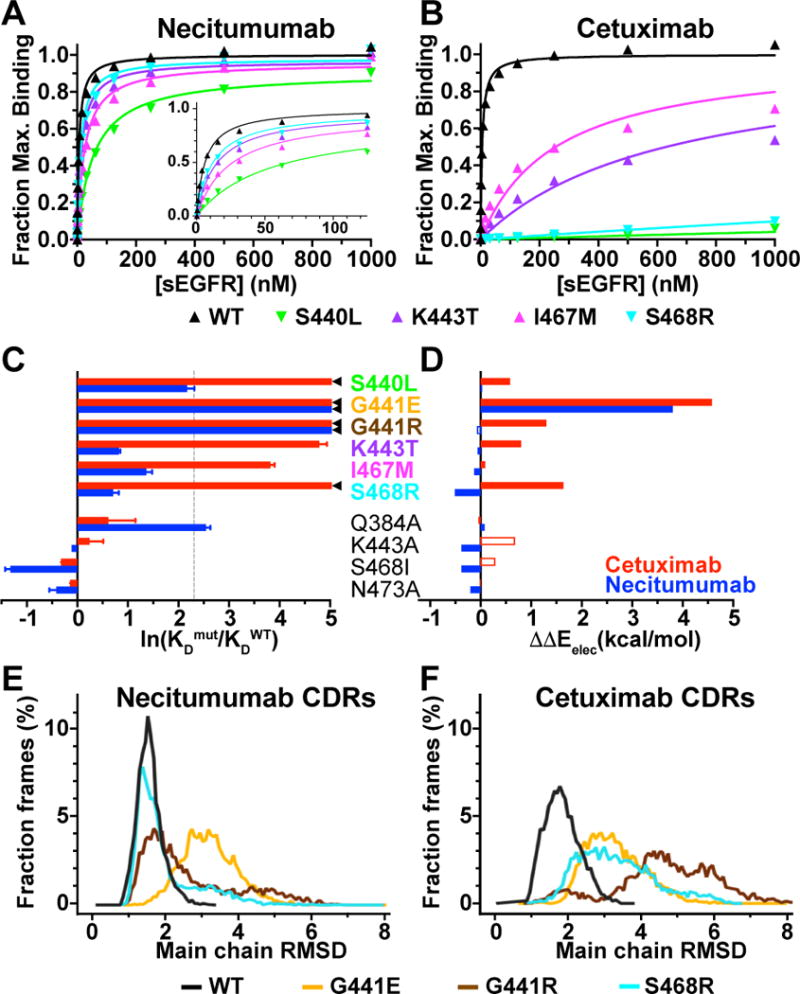
Figure 5. Experimental and computational evaluation of the effect of epitope substitutions on cetuximab and necitumumab binding to EGFR.

A and B, SPR binding of indicated sEGFR variants to necitumumab (A) and cetuximab (B) Fabs, analyzed as described in the legend to Fig. 2. Mean KD values are in Supplementary Table S2. C, experimental change in binding due to the indicated substitution in sEGFR for cetuximab (red) and necitumumab (blue), plotted as the natural log of the ratio of the KD value for mutated EGFR to the KD value of WT; ln(KDmut/KDWT). KDmut/KDWT values from Table 1. ◄ indicates ln(KDmut/KDWT) >> 5. Dotted line is at KDmut/KDWT = 10. D, computed change in electrostatic binding energy for each mutated EGFR relative to WT; ΔΔEelec = ΔEelecmut - ΔEelecWT colored as in C. Open bars indicated incorrect predictions (see text and Table 1). E, dynamics of necitumumab CDRs during three independent 200 ns MD simulations when bound to WT (black), G441E (yellow), G441R (brown) and S468R (cyan) EGFR. Structures from 6000 frames were aligned to frame 1 using main chain of domain III. Binned (0.07 Å) RMSD values for main chain CDR atoms, expressed as a percentage of the total number of frames, are plotted as a function of RMSD. Mean (median) of the RMSD cumulative distributions are; WT: 1.54 (1.5) Å, S468R: 1.96 (1.64) Å, G441R: 2.64 (2.17) Å, and G441E: 3.19 (3.14) Å. Differences in mean for WT and G441 substitutions are significant (P<0.001). F, the same analysis as in E for the complexes with cetuximab. Mean (median) values; WT: 1.86 (1.81) Å, S468R: 3.33 (3.19) Å, G441R: 4.71 (4.73) Å, and G441E: 3.31 (3.21) Å. Differences for WT is significant (P<0.001).
