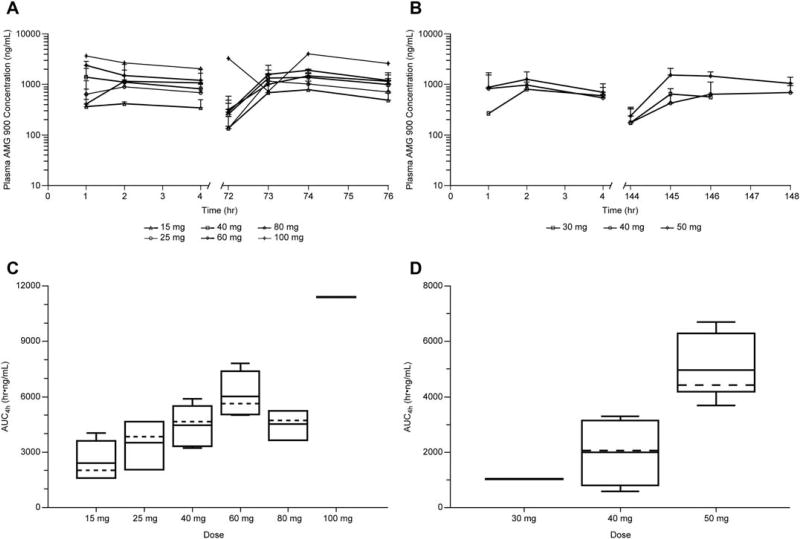
FIGURE 1.
Mean plasma concentration-time profiles following multiple oral administrations for the 4 days on/10 days off schedule (A) or the 7 days on/7 days off schedule (B); area under the concentration-time curve by dose group after the first 4 days of the 4 days on/10 days off schedule (C) or after the first 7 days of the 7 days on/7 days off schedule (D). AUC4h, area under the concentration-time curve from time zero to 4 hours postdose

