
Fig. 1.
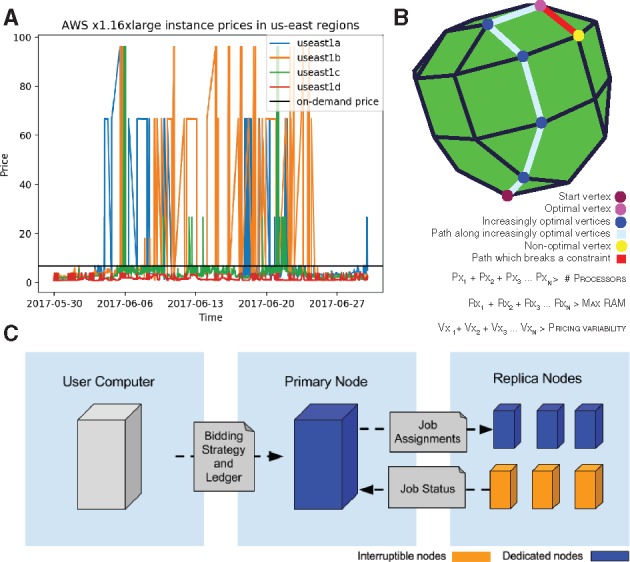
Overview of Aether. (A) Pricing history of an x1.16xlarge EC2 Instance showcasing variability of an order of magnitude, in both directions, for spot prices. (B) Simplified example showing three constraints on a sample bidding approach minimizing an objective function cTx considering cost according to a system of constraints represented as inequalities. x1, x2, … xn represent the number of specific types of compute nodes to solve for. Each inequality represents a constraint and adds another dimension to the space which the simplex algorithm needs to traverse vertices in to find ideal solution. The green line represents the optimal solution. (C) General overview of Aether