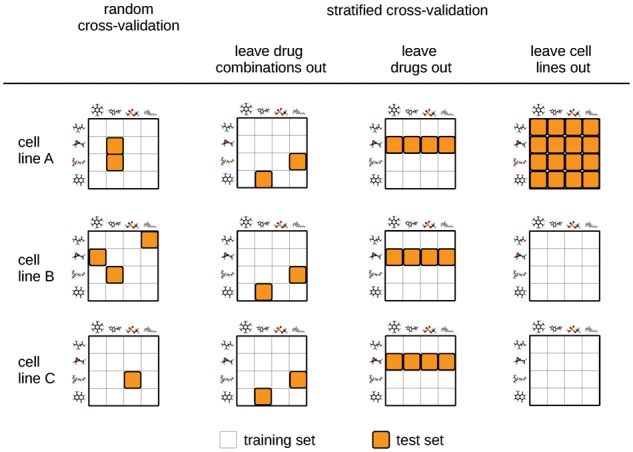
Fig. 3.

Different cross validation strategies. Random cross validation is shown in the first column. Three different stratified cross validation strategies are shown in the following columns. White and orange squares indicate train set and test set samples, respectively (Color version of this figure is available at Bioinformatics online.)
