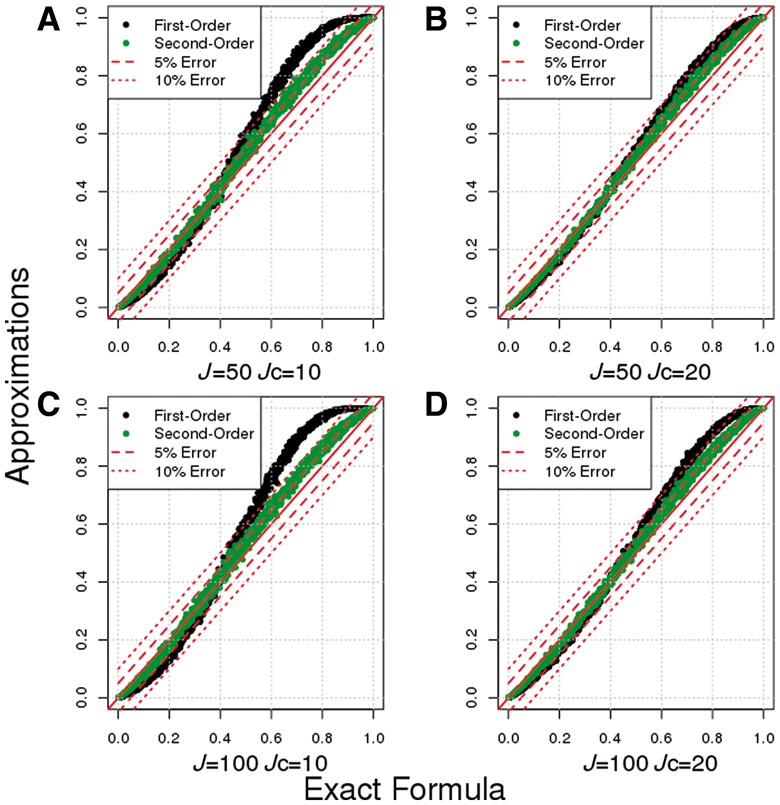
Fig. 1.

Evaluation of the accuracy of the first-and second-order approximations to the power of SKAT test under simulation scenario S1 (MAF-independent EV). Exact Formula represents estimated average power over empirical distribution of MAFs and genetic effect sizes using exact theoretical formulas for the SKAT test statistic. First-order represents estimated average power over empirical distribution of MAFs using the first-order approximation for the SKAT test statistic. Second-order represents estimated average power over empirical distribution of MAFs using the second-order approximation for the SKAT test statistic. 5% and 10% error represents 5% and 10% error bounds over exact power calculations. Number of variants in a locus (J) and number of causal variants (Jc): A) J = 50, Jc = 10; B) J = 50, Jc = 10; C) J = 100, Jc = 10 and D) J = 100, Jc = 20.
